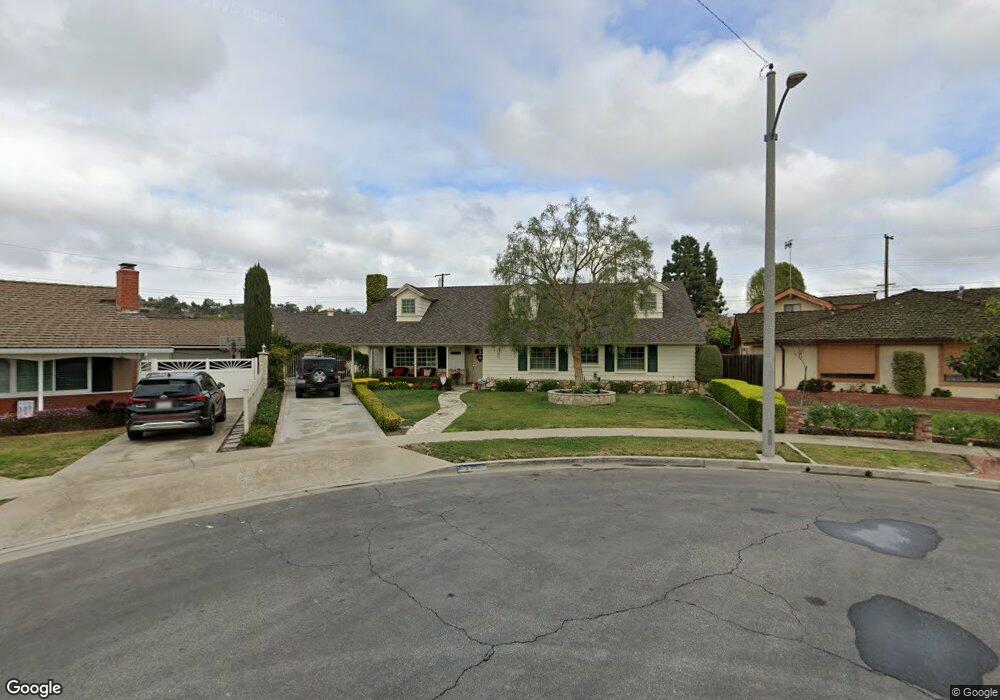
2511 Shady Valley Ln La Habra, CA 90631
Estimated Value: $1,160,000 - $1,558,227
7
Beds
3
Baths
3,581
Sq Ft
$373/Sq Ft
Est. Value
About This Home
This home is located at 2511 Shady Valley Ln, La Habra, CA 90631 and is currently estimated at $1,335,557, approximately $372 per square foot. 2511 Shady Valley Ln is a home located in Orange County with nearby schools including Macy Elementary School, Rancho-Starbuck Intermediate School, and La Habra High School.
Ownership History
Date
Name
Owned For
Owner Type
Purchase Details
Closed on
Jul 30, 2018
Sold by
Jacobsma Kim B and Jacobsma Laila Diane
Bought by
Jacobsma Kim B and Jacobsma Laila D
Current Estimated Value
Purchase Details
Closed on
Sep 7, 2012
Sold by
Jacobsma Kim B and Jacobsma Laila Diane
Bought by
Jacobsma Kim B and Jacobsma Laila Diane
Home Financials for this Owner
Home Financials are based on the most recent Mortgage that was taken out on this home.
Original Mortgage
$417,000
Outstanding Balance
$69,002
Interest Rate
3.5%
Mortgage Type
New Conventional
Estimated Equity
$1,266,555
Purchase Details
Closed on
Jun 4, 1998
Sold by
Smith Donald S
Bought by
Jacobsma Kim B and Jacobsma Laila
Home Financials for this Owner
Home Financials are based on the most recent Mortgage that was taken out on this home.
Original Mortgage
$227,000
Interest Rate
7.01%
Purchase Details
Closed on
Sep 17, 1993
Sold by
Smith Donald S and Smith Virginia L
Bought by
Smith Donald S and Smith Virginia L
Create a Home Valuation Report for This Property
The Home Valuation Report is an in-depth analysis detailing your home's value as well as a comparison with similar homes in the area
Home Values in the Area
Average Home Value in this Area
Purchase History
| Date | Buyer | Sale Price | Title Company |
|---|---|---|---|
| Jacobsma Kim B | -- | None Available | |
| Jacobsma Kim B | -- | Fidelity National Title | |
| Jacobsma Kim B | $355,000 | North American Title Co | |
| Smith Donald S | -- | -- |
Source: Public Records
Mortgage History
| Date | Status | Borrower | Loan Amount |
|---|---|---|---|
| Open | Jacobsma Kim B | $417,000 | |
| Previous Owner | Jacobsma Kim B | $227,000 |
Source: Public Records
Tax History Compared to Growth
Tax History
| Year | Tax Paid | Tax Assessment Tax Assessment Total Assessment is a certain percentage of the fair market value that is determined by local assessors to be the total taxable value of land and additions on the property. | Land | Improvement |
|---|---|---|---|---|
| 2025 | $6,530 | $590,711 | $311,962 | $278,749 |
| 2024 | $6,530 | $579,129 | $305,845 | $273,284 |
| 2023 | $6,375 | $567,774 | $299,848 | $267,926 |
| 2022 | $6,310 | $556,642 | $293,969 | $262,673 |
| 2021 | $6,185 | $545,728 | $288,205 | $257,523 |
| 2020 | $6,172 | $540,133 | $285,250 | $254,883 |
| 2019 | $6,025 | $529,543 | $279,657 | $249,886 |
| 2018 | $5,787 | $519,160 | $274,173 | $244,987 |
| 2017 | $5,684 | $508,981 | $268,797 | $240,184 |
| 2016 | $5,564 | $499,001 | $263,526 | $235,475 |
| 2015 | $5,409 | $491,506 | $259,568 | $231,938 |
| 2014 | $5,243 | $481,879 | $254,484 | $227,395 |
Source: Public Records
Map
Nearby Homes
- 2401 Canfield Dr
- 2311 Canfield Dr
- 16540 Whittier Blvd
- 9331 Mikinda Ave
- 10303 Pounds Ave
- 9422 Canfield Dr
- 2611 Gregory Ln
- 16635 Monte Oro Dr
- 1000 Dolores St
- 9915 Corella Ave
- 16875 Sausalito Dr
- 10418 Bogardus Ave
- 2100 Gregory Ln
- 1436 La Riata Dr
- 16164 Leffco Rd
- 1525 Bonnie Jean Ln
- 16046 Gables Loop
- 16121 Lisco St
- 16621 Crape Myrtle Ln
- 0 Cloister Dr Unit OC24116252
- 2500 Shady Valley Ln
- 2521 Shady Valley Ln
- 1200 Roanoke St
- 1231 Sharpless St
- 1221 Sharpless St
- 2520 Gordon Ave
- 1251 Sharpless St
- 2531 Shady Valley Ln
- 1201 Sharpless St
- 2510 Shady Valley Ln
- 1220 Roanoke St
- 2530 Gordon Ave
- 2520 Shady Valley Ln
- 1271 Sharpless St
- 2601 Shady Valley Ln
- 1191 Sharpless St
- 2530 Sh Ady Ln
- 2530 Shady Valley Ln
- 2600 Gordon Ave
- 9141 Wallace Ave