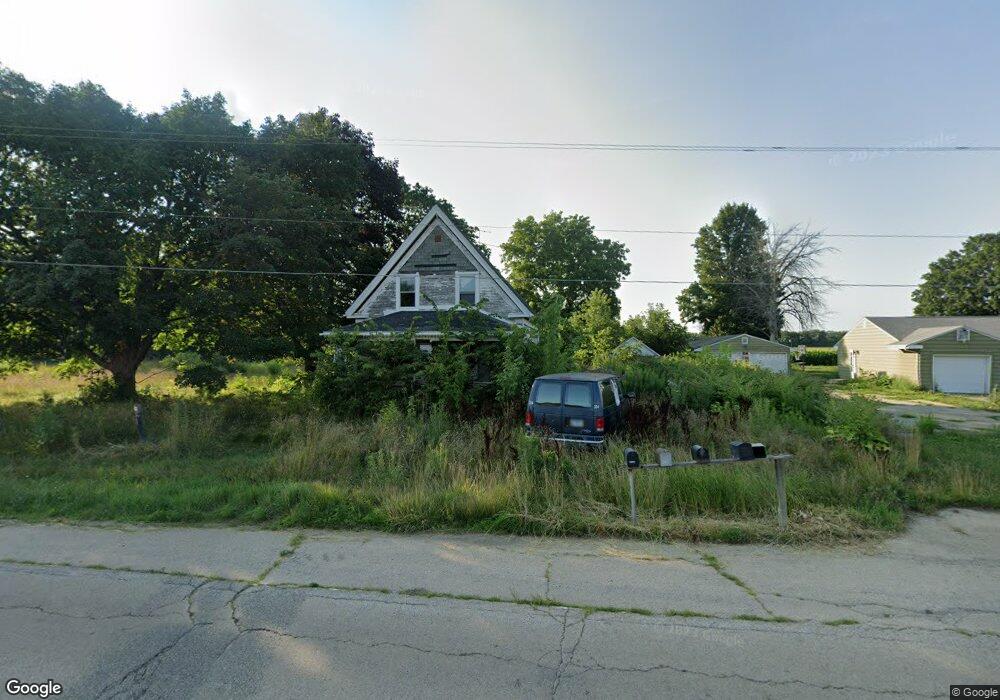
25110 Como Rd Sterling, IL 61081
Estimated Value: $121,000 - $213,000
3
Beds
2
Baths
1,280
Sq Ft
$114/Sq Ft
Est. Value
About This Home
This home is located at 25110 Como Rd, Sterling, IL 61081 and is currently estimated at $146,243, approximately $114 per square foot. 25110 Como Rd is a home located in Whiteside County with nearby schools including St. Andrew Catholic Elementary School.
Ownership History
Date
Name
Owned For
Owner Type
Purchase Details
Closed on
Nov 28, 2005
Sold by
Federal Home Loan Mortgage Corporation
Bought by
Holcomb Walter L
Current Estimated Value
Home Financials for this Owner
Home Financials are based on the most recent Mortgage that was taken out on this home.
Original Mortgage
$54,090
Interest Rate
6.2%
Mortgage Type
Future Advance Clause Open End Mortgage
Purchase Details
Closed on
Sep 1, 2005
Sold by
Cramer Dorian L
Bought by
Federal Home Loan Mortgage Corporation
Create a Home Valuation Report for This Property
The Home Valuation Report is an in-depth analysis detailing your home's value as well as a comparison with similar homes in the area
Home Values in the Area
Average Home Value in this Area
Purchase History
| Date | Buyer | Sale Price | Title Company |
|---|---|---|---|
| Holcomb Walter L | -- | None Available | |
| Federal Home Loan Mortgage Corporation | -- | None Available |
Source: Public Records
Mortgage History
| Date | Status | Borrower | Loan Amount |
|---|---|---|---|
| Closed | Holcomb Walter L | $54,090 |
Source: Public Records
Tax History
| Year | Tax Paid | Tax Assessment Tax Assessment Total Assessment is a certain percentage of the fair market value that is determined by local assessors to be the total taxable value of land and additions on the property. | Land | Improvement |
|---|---|---|---|---|
| 2024 | $1,772 | $26,092 | $5,072 | $21,020 |
| 2023 | $1,648 | $24,298 | $4,723 | $19,575 |
| 2022 | $1,533 | $22,182 | $4,312 | $17,870 |
| 2021 | $1,494 | $21,285 | $4,710 | $16,575 |
| 2020 | $1,414 | $20,061 | $4,439 | $15,622 |
| 2019 | $1,329 | $18,556 | $4,106 | $14,450 |
| 2018 | $1,302 | $18,303 | $4,050 | $14,253 |
| 2017 | $1,298 | $17,746 | $3,927 | $13,819 |
| 2016 | $1,529 | $18,836 | $4,168 | $14,668 |
| 2015 | $1,771 | $29,729 | $3,959 | $25,770 |
| 2014 | $1,532 | $20,452 | $4,091 | $16,361 |
| 2013 | $1,771 | $29,729 | $3,959 | $25,770 |
Source: Public Records
Map
Nearby Homes
- 0 Deer Run Unit MRD12556635
- 12855 Lawrence Rd
- 23730 Lincoln Hwy
- 901 Oak Ave
- 2202 Chestnut Ave
- 1206 Harvey Dr
- 1411 N Ridge Dr
- 1905 14th Ave
- 1404 13th Ave
- 15581 Highland Dr
- 1214 W 20th St
- 1215 W 20th St
- 1504 Flock Ave
- 909 W 6th St
- 1003 W 2nd St
- 722 9th Ave
- 802 W 4th St
- 509 Avenue I
- 1001 W 9th St
- Lot 8 Knief Rd
Your Personal Tour Guide
Ask me questions while you tour the home.