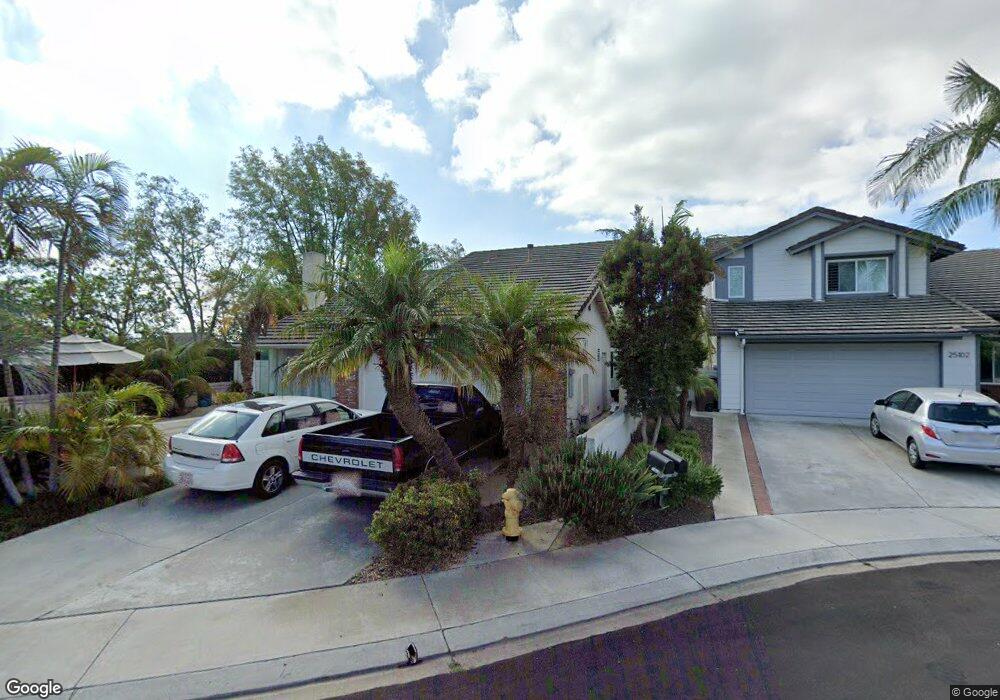
25112 Danapepper Dana Point, CA 92629
Dana Hills NeighborhoodEstimated Value: $1,411,441 - $1,942,000
3
Beds
2
Baths
1,550
Sq Ft
$1,129/Sq Ft
Est. Value
About This Home
This home is located at 25112 Danapepper, Dana Point, CA 92629 and is currently estimated at $1,749,360, approximately $1,128 per square foot. 25112 Danapepper is a home located in Orange County with nearby schools including Del Obispo Elementary School, Marco Forster Middle School, and Dana Hills High School.
Ownership History
Date
Name
Owned For
Owner Type
Purchase Details
Closed on
Jun 28, 2019
Sold by
Cantleberry Frank W and Sun Heidi Yonghua
Bought by
Cantleberry And Sun Family Trust and Cantleberry
Current Estimated Value
Purchase Details
Closed on
Oct 25, 2012
Sold by
Cantleberry Frank W and Sun Heidi Yonghua
Bought by
Cantleberry Frank W and Sun Heidi Younghua
Home Financials for this Owner
Home Financials are based on the most recent Mortgage that was taken out on this home.
Original Mortgage
$300,000
Interest Rate
3.43%
Mortgage Type
New Conventional
Purchase Details
Closed on
Jun 15, 2004
Sold by
Cantleberry Frank W
Bought by
Cantleberry Frank W and Sun Heidi Yonghua
Home Financials for this Owner
Home Financials are based on the most recent Mortgage that was taken out on this home.
Original Mortgage
$333,699
Interest Rate
6.29%
Mortgage Type
New Conventional
Purchase Details
Closed on
Apr 22, 2003
Sold by
Cantleberry Frank W
Bought by
Cantleberry Frank W
Purchase Details
Closed on
Jul 8, 1994
Sold by
Cantleberry Frank W and Cantleberry Kim M
Bought by
Cantleberry Frank W and Cantleberry Kim M
Create a Home Valuation Report for This Property
The Home Valuation Report is an in-depth analysis detailing your home's value as well as a comparison with similar homes in the area
Home Values in the Area
Average Home Value in this Area
Purchase History
| Date | Buyer | Sale Price | Title Company |
|---|---|---|---|
| Cantleberry And Sun Family Trust | -- | None Listed On Document | |
| Cantleberry Frank W | -- | First American Title Company | |
| Cantleberry Frank W | -- | Ticor Title Co Of California | |
| Cantleberry Frank W | -- | -- | |
| Cantleberry Frank W | -- | -- |
Source: Public Records
Mortgage History
| Date | Status | Borrower | Loan Amount |
|---|---|---|---|
| Previous Owner | Cantleberry Frank W | $300,000 | |
| Previous Owner | Cantleberry Frank W | $333,699 |
Source: Public Records
Tax History
| Year | Tax Paid | Tax Assessment Tax Assessment Total Assessment is a certain percentage of the fair market value that is determined by local assessors to be the total taxable value of land and additions on the property. | Land | Improvement |
|---|---|---|---|---|
| 2025 | $3,342 | $342,021 | $155,713 | $186,308 |
| 2024 | $3,342 | $335,315 | $152,660 | $182,655 |
| 2023 | $3,270 | $328,741 | $149,667 | $179,074 |
| 2022 | $3,206 | $322,296 | $146,733 | $175,563 |
| 2021 | $3,143 | $315,977 | $143,856 | $172,121 |
| 2020 | $3,111 | $312,738 | $142,381 | $170,357 |
| 2019 | $3,091 | $306,606 | $139,589 | $167,017 |
| 2018 | $3,080 | $300,595 | $136,852 | $163,743 |
| 2017 | $2,998 | $294,701 | $134,168 | $160,533 |
| 2016 | $2,995 | $288,923 | $131,537 | $157,386 |
| 2015 | $2,908 | $284,584 | $129,562 | $155,022 |
| 2014 | $2,860 | $279,010 | $127,024 | $151,986 |
Source: Public Records
Map
Nearby Homes
- 32921 Danaoak
- 7 Tattersall
- 33142 Sea Lion Dr
- 31 La Paloma
- 33072 Ocean Ridge
- 33121 Ocean Ridge
- 33211 Blue Fin Dr
- 25262 Brigantine Dr
- 33231 Big Sur St
- 5 Old Ranch Rd
- 33042 Palo Alto St
- 32791 Del Obispo St
- 33162 Paseo Pinto
- 24751 Camarillo St
- 33371 Cheltam Way Unit 3
- 33371 Cheltam Way Unit 2
- 11 Placid Harbor
- 1 Baycrest Place
- 26 Sunbridge Place
- 33041 Lighthouse Ct
- 25102 Danapepper
- 25132 Danapepper
- 25096 Danapepper
- 25094 Danapepper
- 25111 Danabirch
- 25121 Danabirch
- 25101 Danabirch
- 25092 Danapepper
- 25101 Danapepper
- 25141 Danabirch
- 25091 Danapepper
- 25142 Danapepper
- 25091 Danabirch
- 25151 Danabirch
- 25093 Danapepper
- 25131 Danapepper
- 25152 Danapepper
- 25141 Danapepper
- 25081 Danabirch
- 25161 Danabirch
Your Personal Tour Guide
Ask me questions while you tour the home.