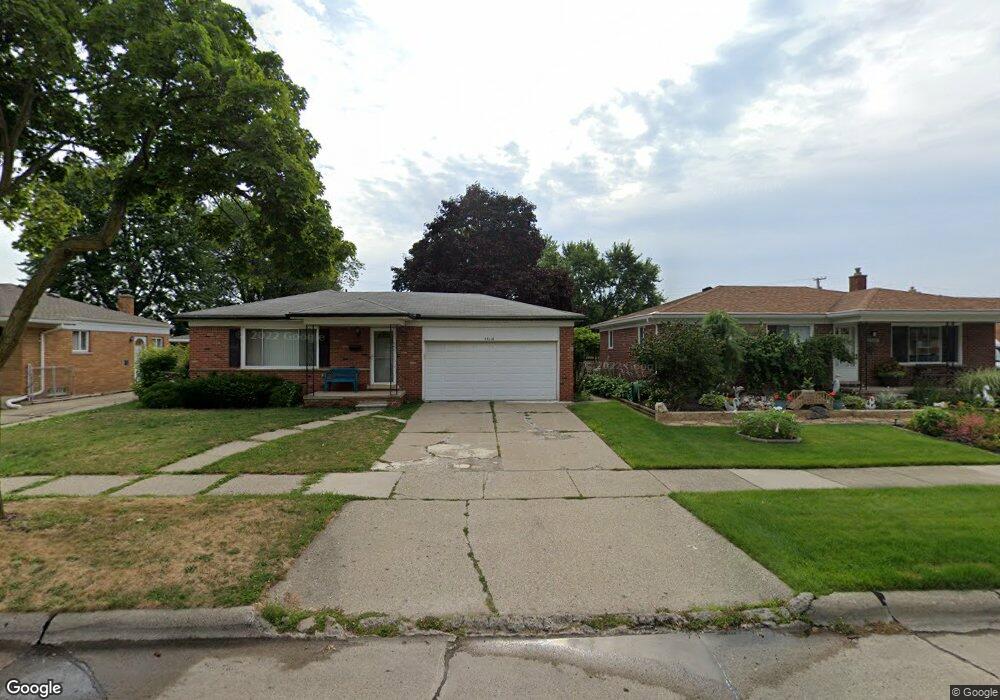
25116 Loretta Ave Unit Bldg-Unit Warren, MI 48091
Southwest Warren NeighborhoodEstimated Value: $234,000 - $263,000
3
Beds
2
Baths
1,203
Sq Ft
$203/Sq Ft
Est. Value
About This Home
This home is located at 25116 Loretta Ave Unit Bldg-Unit, Warren, MI 48091 and is currently estimated at $244,466, approximately $203 per square foot. 25116 Loretta Ave Unit Bldg-Unit is a home located in Macomb County with nearby schools including Mark C. Roose Elementary School, Center Line High School, and Wolfe Middle School.
Ownership History
Date
Name
Owned For
Owner Type
Purchase Details
Closed on
Oct 16, 2019
Sold by
Chowdhury Sidratul
Bought by
Chowdhury Sidratul and Chowdhury Hasina
Current Estimated Value
Home Financials for this Owner
Home Financials are based on the most recent Mortgage that was taken out on this home.
Original Mortgage
$99,000
Outstanding Balance
$66,001
Interest Rate
3.5%
Mortgage Type
New Conventional
Estimated Equity
$178,465
Purchase Details
Closed on
Jun 29, 2018
Sold by
Nidhal Eleya Salim Yakeen and Nidhal Kinaja
Bought by
Chowdbury Sidratul
Purchase Details
Closed on
Aug 20, 2012
Sold by
Maqdasi Rafie and Esho Lidia
Bought by
Eleya Salim Yakeen
Purchase Details
Closed on
Aug 11, 2011
Sold by
Serda Susan
Bought by
Federal Home Loan Mortgage Corporation
Purchase Details
Closed on
Dec 15, 1995
Sold by
Webb M
Bought by
Serda S
Create a Home Valuation Report for This Property
The Home Valuation Report is an in-depth analysis detailing your home's value as well as a comparison with similar homes in the area
Home Values in the Area
Average Home Value in this Area
Purchase History
| Date | Buyer | Sale Price | Title Company |
|---|---|---|---|
| Chowdhury Sidratul | -- | Malt | |
| Chowdbury Sidratul | $141,000 | None Available | |
| Eleya Salim Yakeen | $51,000 | None Available | |
| Federal Home Loan Mortgage Corporation | $97,580 | None Available | |
| Serda S | $87,500 | -- |
Source: Public Records
Mortgage History
| Date | Status | Borrower | Loan Amount |
|---|---|---|---|
| Open | Chowdhury Sidratul | $99,000 |
Source: Public Records
Tax History Compared to Growth
Tax History
| Year | Tax Paid | Tax Assessment Tax Assessment Total Assessment is a certain percentage of the fair market value that is determined by local assessors to be the total taxable value of land and additions on the property. | Land | Improvement |
|---|---|---|---|---|
| 2025 | $4,670 | $102,140 | $0 | $0 |
| 2024 | $4,558 | $92,420 | $0 | $0 |
| 2023 | $4,414 | $80,450 | $0 | $0 |
| 2022 | $4,265 | $72,210 | $0 | $0 |
| 2021 | $4,338 | $68,740 | $0 | $0 |
| 2020 | $4,230 | $64,790 | $0 | $0 |
| 2019 | $4,151 | $62,560 | $0 | $0 |
| 2018 | $0 | $50,860 | $0 | $0 |
| 2017 | $2,090 | $44,650 | $6,140 | $38,510 |
| 2016 | $2,080 | $44,650 | $0 | $0 |
| 2015 | -- | $35,370 | $0 | $0 |
| 2013 | $4,439 | $34,510 | $0 | $0 |
Source: Public Records
Map
Nearby Homes
- 4949 E 10 Mile Rd
- 4973 E 10 Mile Rd Unit 8
- 4925 E 10 Mile Rd Unit 4
- 4225 Kiefer Ave
- 25729 Loretta Ave
- 24918 Patricia Ave
- 25744 Masch Ave
- 24596 Eureka Ave
- 24733 Patricia Ave
- 24653 Eureka Ave
- 24609 Eureka Ave
- 24755 Hill Ave
- 25838 Masch Ave
- 24756 Hill Ave
- 24472 Beierman Ave
- 25755 Patricia Ave
- 24370 Eureka Ave
- 24544 Patricia Ave
- 24248 Cunningham Ave
- 24749 Panama Ave
- 25116 Loretta Ave
- 25104 Loretta Ave
- 25128 Loretta Ave
- 25078 Loretta Ave
- 25140 Loretta Ave
- 25066 Loretta Ave
- 25152 Loretta Ave
- 25105 Masch Ave
- 25115 Loretta Ave Unit Bldg-Unit
- 25115 Loretta Ave
- 25127 Loretta Ave
- 25103 Loretta Ave
- 25054 Loretta Ave
- 25164 Loretta Ave
- 25077 Loretta Ave
- 25139 Loretta Ave
- 25101 Masch Ave
- 25129 Masch Ave
- 25065 Loretta Ave
- 25151 Loretta Ave