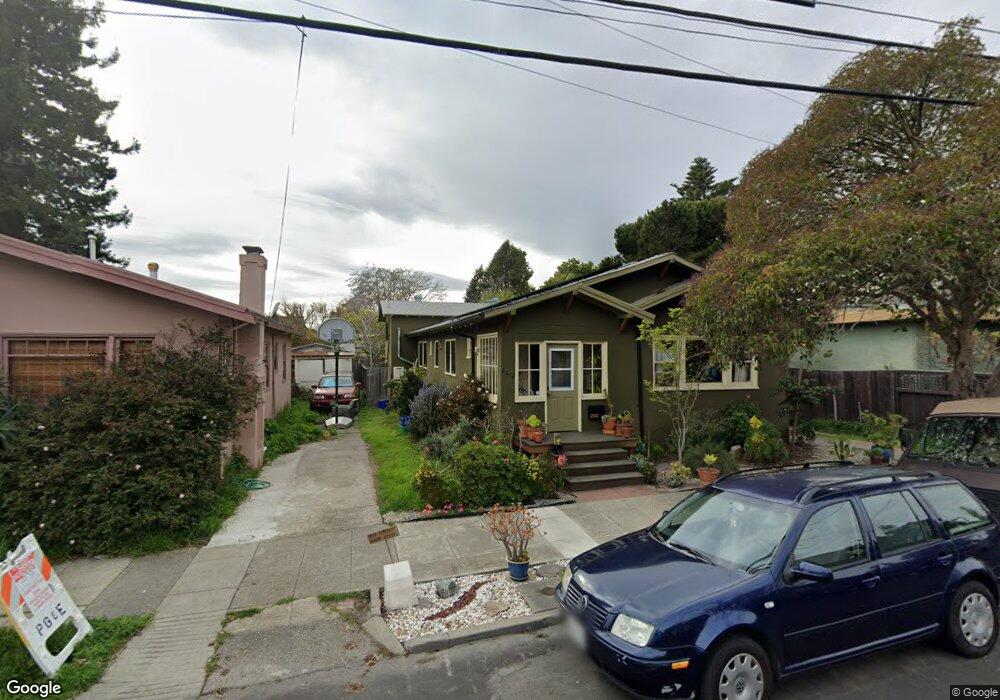
2512 McGee Ave Berkeley, CA 94703
South Berkeley NeighborhoodEstimated Value: $1,066,688 - $1,260,000
4
Beds
1
Bath
1,483
Sq Ft
$784/Sq Ft
Est. Value
About This Home
This home is located at 2512 McGee Ave, Berkeley, CA 94703 and is currently estimated at $1,162,172, approximately $783 per square foot. 2512 McGee Ave is a home located in Alameda County with nearby schools including Washington Elementary School, Malcolm X Elementary School, and Berkeley Arts Magnet at Whittier School.
Ownership History
Date
Name
Owned For
Owner Type
Purchase Details
Closed on
Apr 17, 2025
Sold by
Levinson David and Olivarez-Levinson Ana
Bought by
Olivarez-Levinson Family Trust and Levinson
Current Estimated Value
Purchase Details
Closed on
Apr 15, 2021
Sold by
Levinson David H and Levinson Steven
Bought by
Levinson David H and Levinson Steven
Purchase Details
Closed on
Jan 23, 1995
Sold by
Levinson Saul and Levinson Cecele S
Bought by
Levinson Saul and Levinson Cecele S
Create a Home Valuation Report for This Property
The Home Valuation Report is an in-depth analysis detailing your home's value as well as a comparison with similar homes in the area
Home Values in the Area
Average Home Value in this Area
Purchase History
| Date | Buyer | Sale Price | Title Company |
|---|---|---|---|
| Olivarez-Levinson Family Trust | -- | None Listed On Document | |
| Levinson David | -- | None Listed On Document | |
| Levinson David H | -- | None Available | |
| Levinson Saul | -- | -- |
Source: Public Records
Tax History
| Year | Tax Paid | Tax Assessment Tax Assessment Total Assessment is a certain percentage of the fair market value that is determined by local assessors to be the total taxable value of land and additions on the property. | Land | Improvement |
|---|---|---|---|---|
| 2025 | $4,880 | $49,145 | $30,892 | $25,253 |
| 2024 | $4,880 | $48,044 | $30,286 | $24,758 |
| 2023 | $5,379 | $53,965 | $29,693 | $24,272 |
| 2022 | $4,682 | $45,907 | $29,110 | $23,797 |
| 2021 | $4,637 | $44,870 | $28,540 | $23,330 |
| 2020 | $4,268 | $51,338 | $28,247 | $23,091 |
| 2019 | $3,946 | $50,331 | $27,693 | $22,638 |
| 2018 | $3,809 | $49,344 | $27,150 | $22,194 |
| 2017 | $3,643 | $48,377 | $26,618 | $21,759 |
| 2016 | $3,387 | $47,428 | $26,096 | $21,332 |
| 2015 | $3,305 | $46,716 | $25,704 | $21,012 |
| 2014 | $3,160 | $45,801 | $25,201 | $20,600 |
Source: Public Records
Map
Nearby Homes
- 1634 Blake St
- 1645 Dwight Way
- 1604 Dwight Way
- 1612 Parker St
- 1612 Carleton St
- 1515 Derby St
- 2701 Grant St
- 1901 Parker St Unit 3
- 2350 Sacramento St
- 2750 Sacramento St
- 1450 Ward St
- 2758 Sacramento St
- 2774 Sacramento St
- 2782 Sacramento St
- 2790 Sacramento St
- 2829 California St
- 2018 Blake St
- 2218 -2222 Grant St
- 2118 California St
- 1535 Julia St
Your Personal Tour Guide
Ask me questions while you tour the home.