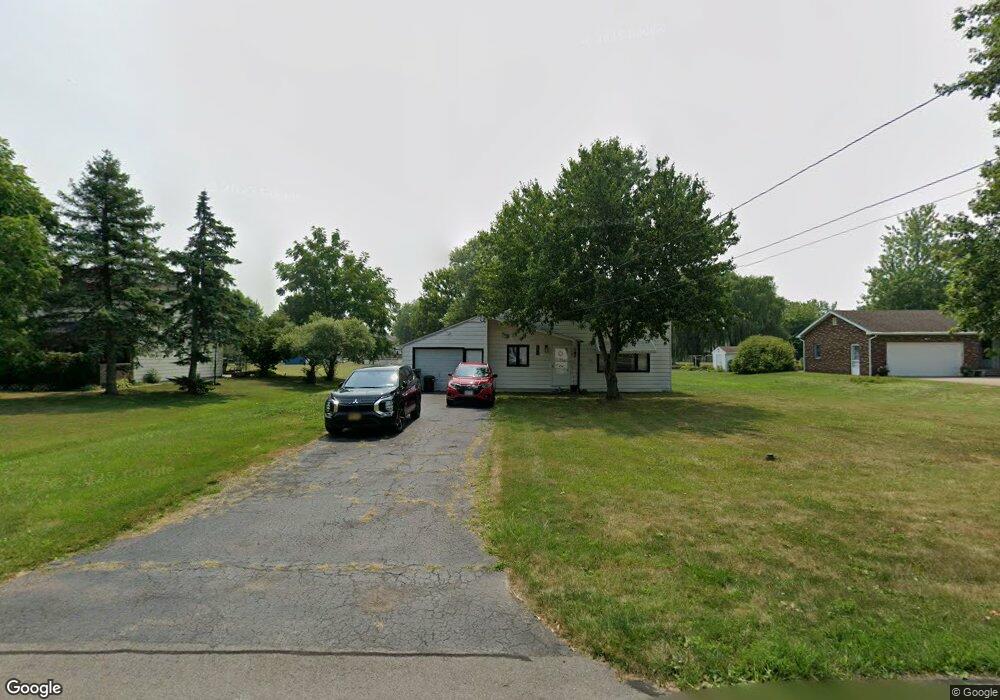
2512 Washington St Niagara Falls, NY 14304
Estimated Value: $233,000 - $277,000
3
Beds
2
Baths
1,410
Sq Ft
$182/Sq Ft
Est. Value
About This Home
This home is located at 2512 Washington St, Niagara Falls, NY 14304 and is currently estimated at $257,145, approximately $182 per square foot. 2512 Washington St is a home located in Niagara County with nearby schools including Edward Town Middle School, Niagara-Wheatfield Senior High School, and St. John Lutheran School.
Ownership History
Date
Name
Owned For
Owner Type
Purchase Details
Closed on
Jul 22, 2022
Sold by
Rothberg Noah R
Bought by
Rothberg Lauren R
Current Estimated Value
Home Financials for this Owner
Home Financials are based on the most recent Mortgage that was taken out on this home.
Original Mortgage
$179,746
Interest Rate
6.77%
Mortgage Type
FHA
Purchase Details
Closed on
Jun 27, 2021
Sold by
Molar Development Llc
Bought by
Rothberg Lauren R and Rothberg Noah R
Home Financials for this Owner
Home Financials are based on the most recent Mortgage that was taken out on this home.
Original Mortgage
$166,500
Interest Rate
2.9%
Mortgage Type
New Conventional
Purchase Details
Closed on
Sep 26, 2017
Sold by
County Of Niagara New York
Bought by
Molar Development Llc
Purchase Details
Closed on
Jul 31, 2008
Sold by
Zysk Andrea
Bought by
Scarupa Andrew
Create a Home Valuation Report for This Property
The Home Valuation Report is an in-depth analysis detailing your home's value as well as a comparison with similar homes in the area
Home Values in the Area
Average Home Value in this Area
Purchase History
| Date | Buyer | Sale Price | Title Company |
|---|---|---|---|
| Rothberg Lauren R | -- | None Listed On Document | |
| Rothberg Lauren R | $185,000 | Stewart Title Insurance Co | |
| Molar Development Llc | $62,000 | -- | |
| Scarupa Andrew | -- | Kathleen Gaines |
Source: Public Records
Mortgage History
| Date | Status | Borrower | Loan Amount |
|---|---|---|---|
| Previous Owner | Rothberg Lauren R | $179,746 | |
| Previous Owner | Rothberg Lauren R | $166,500 |
Source: Public Records
Tax History Compared to Growth
Tax History
| Year | Tax Paid | Tax Assessment Tax Assessment Total Assessment is a certain percentage of the fair market value that is determined by local assessors to be the total taxable value of land and additions on the property. | Land | Improvement |
|---|---|---|---|---|
| 2024 | $5,238 | $85,300 | $12,600 | $72,700 |
| 2023 | $5,238 | $85,300 | $12,600 | $72,700 |
| 2022 | $5,074 | $85,300 | $12,600 | $72,700 |
| 2021 | $4,982 | $85,300 | $12,600 | $72,700 |
| 2020 | $4,159 | $85,300 | $12,600 | $72,700 |
| 2019 | $3,603 | $85,300 | $12,600 | $72,700 |
| 2018 | $4,268 | $85,300 | $12,600 | $72,700 |
| 2017 | $3,603 | $85,300 | $12,600 | $72,700 |
| 2016 | $5,959 | $85,300 | $12,600 | $72,700 |
| 2015 | -- | $85,300 | $12,600 | $72,700 |
| 2014 | -- | $85,300 | $12,600 | $72,700 |
Source: Public Records
Map
Nearby Homes
- 2509 Washington St
- 2454 Niagara Rd
- 6747 Rose Ct
- 6743 Sy Rd
- 2538 Niagara Falls Blvd
- 2800 Driftwood Dr
- 0 Danielle Dr
- 6409 Ward Rd
- 6401 Ward Rd
- VL Jagow Rd S
- 2185 Violet Cir
- 6717 Errick Rd
- 2305 Lockport Rd
- 6933 Walmore Rd
- 0 Errick Rd
- 6955 Deborah Ln
- 2466 King Fisher Ln
- 7007 Witmer Rd
- V/L Errick (Lemke) Dr
- 7024 Lakeside Dr
- 2506 Washington St
- 2518 Washington St
- 2502 Washington St
- 2524 Washington St
- 2505 Washington St
- 2515 Washington St
- 2498 Washington St
- 2528 Washington St
- 2503 Washington St
- 2503 Niagara Rd
- 2509 Niagara Rd
- 2521 Washington St
- 2519 Niagara Rd
- 2510 Stoelting St
- 2516 Stoelting St
- 6637 Luther St
- 6632 Hunt St
- 6636 Hunt St
- 2499 Washington St
- 2525 Washington St