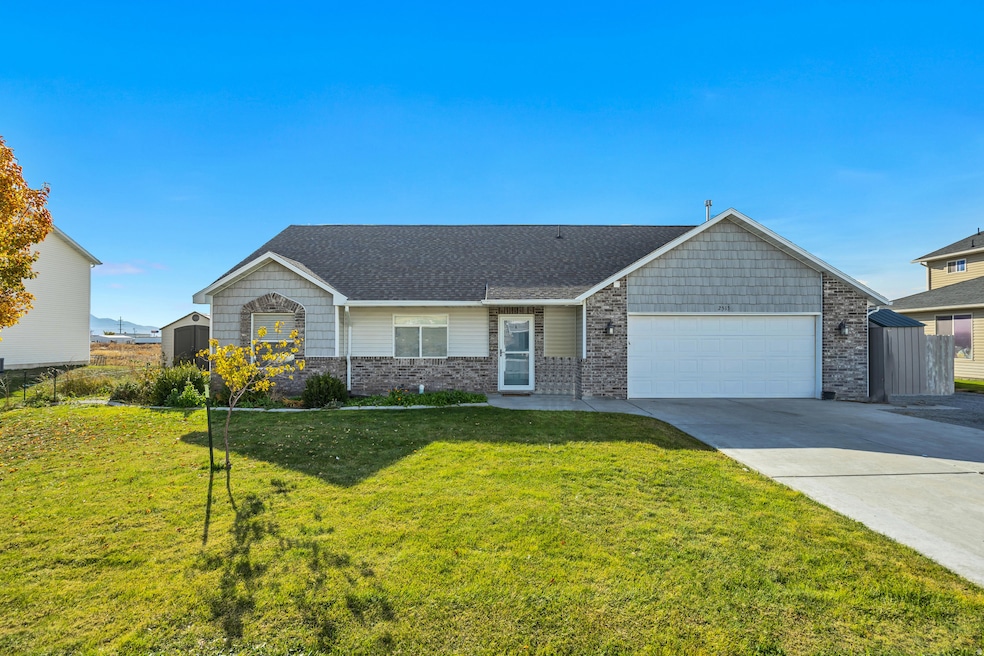
2513 W 600 N Tremonton, UT 84337
Estimated payment $2,441/month
Highlights
- Solar Power System
- Fruit Trees
- Rambler Architecture
- Updated Kitchen
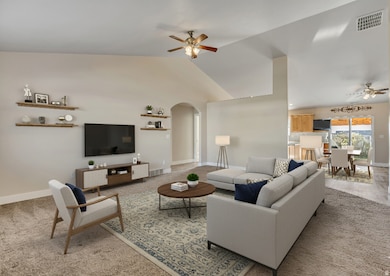
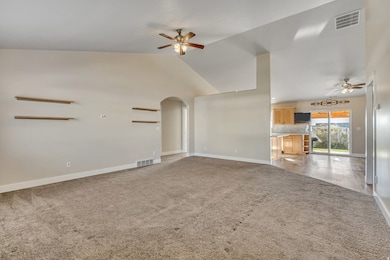
- Vaulted Ceiling
- Great Room
About This Home
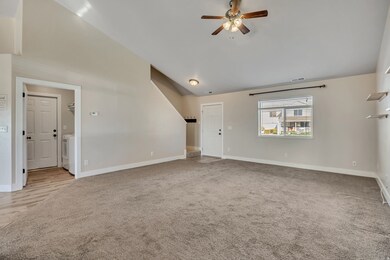
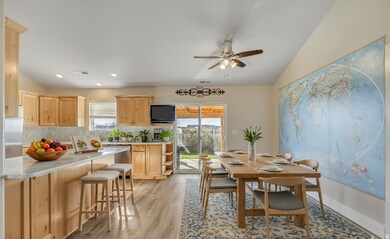
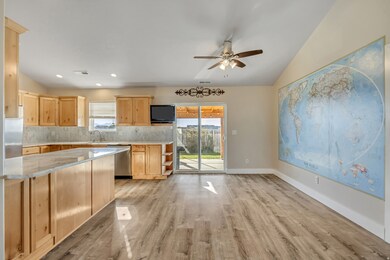
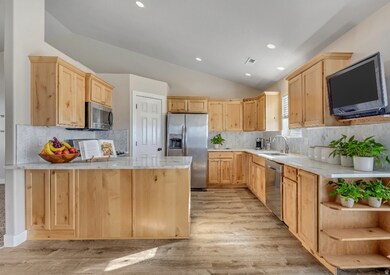
*** PRICE REDUCED***Come take a look! This beautifully updated single-level residence offers modern comforts and exceptional features. Enjoy a refreshed kitchen with brand-new appliances (installed within the last 3 years) and sleek quartzite countertops. Unwind under the covered patio & save on energy costs with 21 solar panels. MAIN FLOOR GREAT ROOM HAS FULL LAMINATE UNDER THE CARPET IF PREFERRED! The fully-fenced backyard is a private retreat, complete with mature landscaping, 4 bearing fruit trees, a garden area, and a 25-ft private well for irrigation. A versatile bonus room above the double-car garage serves as a potential bedroom or office. The garage is treat with extra storage shelves and a fruit room. Washer, dryer, refrigerator, 2 sheds, and RV parking are all included! With an automatic sprinkler system and thoughtful upgrades throughout, this move-in-ready home is perfect for comfortable, modern living. Don't miss this incredible opportunity! Square footage figures are provided as a courtesy estimate only and were obtained from floor plan scan and county records. Buyer is advised to obtain an independent measurement.
Co-Listing Agent
Gary Sundwall
KW Utah Realtors Keller Williams License #10469145
Home Details
Home Type
- Single Family
Est. Annual Taxes
- $2,413
Year Built
- Built in 2010
Lot Details
- 7,841 Sq Ft Lot
- Property is Fully Fenced
- Landscaped
- Fruit Trees
- Mature Trees
- Vegetable Garden
- Property is zoned Single-Family
Parking
- 2 Car Attached Garage
Home Design
- Rambler Architecture
- Brick Exterior Construction
Interior Spaces
- 1,948 Sq Ft Home
- 2-Story Property
- Vaulted Ceiling
- Double Pane Windows
- Blinds
- Sliding Doors
- Great Room
Kitchen
- Updated Kitchen
- Gas Range
- Range Hood
- Disposal
Flooring
- Carpet
- Laminate
Bedrooms and Bathrooms
- 4 Bedrooms | 3 Main Level Bedrooms
- Walk-In Closet
- 2 Full Bathrooms
Laundry
- Dryer
- Washer
Home Security
- Smart Thermostat
- Storm Doors
Eco-Friendly Details
- Solar Power System
- Solar owned by seller
- Sprinkler System
Outdoor Features
- Covered Patio or Porch
- Storage Shed
Schools
- North Park Elementary School
- Bear River Middle School
- Bear River High School
Utilities
- Forced Air Heating and Cooling System
- Natural Gas Connected
- Well
Community Details
- No Home Owners Association
- River Valley Subdivision
Listing and Financial Details
- Exclusions: Hot Tub
- Assessor Parcel Number 05-238-0033
Map
Home Values in the Area
Average Home Value in this Area
Tax History
| Year | Tax Paid | Tax Assessment Tax Assessment Total Assessment is a certain percentage of the fair market value that is determined by local assessors to be the total taxable value of land and additions on the property. | Land | Improvement |
|---|---|---|---|---|
| 2025 | $2,603 | $405,041 | $135,000 | $270,041 |
| 2024 | $2,413 | $417,886 | $140,000 | $277,886 |
| 2023 | $2,550 | $433,521 | $145,000 | $288,521 |
| 2022 | $1,932 | $187,346 | $19,250 | $168,096 |
| 2021 | $1,700 | $229,632 | $35,000 | $194,632 |
| 2020 | $1,491 | $229,632 | $35,000 | $194,632 |
| 2019 | $1,387 | $113,983 | $19,250 | $94,733 |
| 2018 | $1,503 | $112,779 | $19,250 | $93,529 |
| 2017 | $1,553 | $205,053 | $19,250 | $170,053 |
| 2016 | $1,527 | $108,325 | $19,250 | $89,075 |
| 2015 | $1,388 | $100,228 | $19,250 | $80,978 |
| 2014 | $1,388 | $96,372 | $19,250 | $77,122 |
| 2013 | -- | $96,372 | $19,273 | $77,099 |
Property History
| Date | Event | Price | List to Sale | Price per Sq Ft |
|---|---|---|---|---|
| 11/12/2025 11/12/25 | Price Changed | $425,000 | -2.7% | $218 / Sq Ft |
| 10/18/2025 10/18/25 | For Sale | $437,000 | -- | $224 / Sq Ft |
Purchase History
| Date | Type | Sale Price | Title Company |
|---|---|---|---|
| Warranty Deed | -- | American Secure Ttl Tremonto | |
| Warranty Deed | -- | American Secure Ttl Tremonto | |
| Warranty Deed | -- | -- |
Mortgage History
| Date | Status | Loan Amount | Loan Type |
|---|---|---|---|
| Open | $196,000 | New Conventional | |
| Previous Owner | $166,429 | FHA |
Source: UtahRealEstate.com
MLS Number: 2118309
APN: 05-238-0033
Disclaimer: Certain information contained herein is derived from information provided by parties other than Homes.com. All information provided is deemed reliable, but is not guaranteed to be accurate and should be independently verified.
![]() IDX information is provided exclusively for consumers’ personal, non-commercial use, that it may not be used for any purpose other than to identify prospective properties consumers may be interested in purchasing, and that the data is deemed reliable but is not guaranteed accurate by the MLS. Licensor is only providing the MLS Content and not other sources of data provided in the Product.
IDX information is provided exclusively for consumers’ personal, non-commercial use, that it may not be used for any purpose other than to identify prospective properties consumers may be interested in purchasing, and that the data is deemed reliable but is not guaranteed accurate by the MLS. Licensor is only providing the MLS Content and not other sources of data provided in the Product.
Based on information from the Wasatch Front Regional Multiple Listing Service, Inc.. All data, including all measurements and calculations of area, is obtained from various sources and has not been, and will not be, verified by broker or the MLS. All information should be independently reviewed and verified for accuracy. Properties may or may not be listed by the office/agent presenting the information.
- 2556 W 600 N
- 2460 W 450 N Unit 10
- 475 N 2650 W
- 810 N 2300 W
- River Valley Plan at River Valley Townhome Community - River Valley
- 877 N 2300 W
- 971 N 2300 W
- 2545 W Mountain Rd
- 3101 W 1000 N
- 2618 W Mountain Rd
- 1069 N 2800 W
- 1081 N 2800 W
- 2411 W 1150 N Unit 11
- 2368 W 1150 N Unit 3
- 2442 W 1150 N Unit 1
- 2342 W 1150 N Unit 4
- 2436 W 1150 N Unit 12
- 2389 W 1150 N Unit 10
- 2371 W 1150 N Unit 9
- 2353 W 1150 N Unit 8
