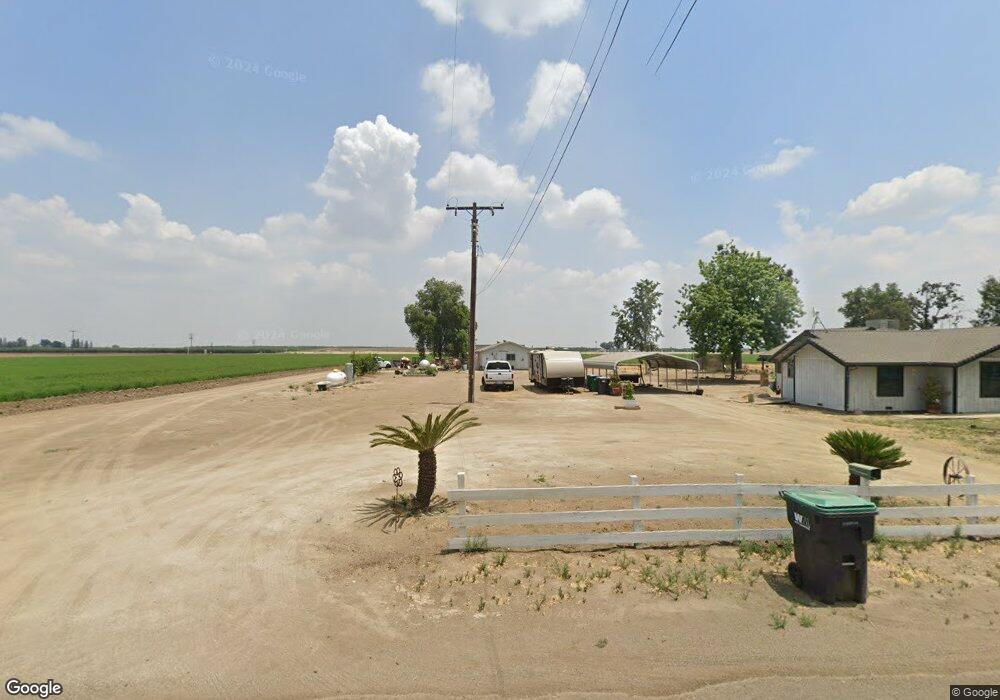
2514 N Colpien Rd Unit A Tulare, CA 93274
Estimated Value: $484,000 - $577,000
3
Beds
2
Baths
1,674
Sq Ft
$319/Sq Ft
Est. Value
About This Home
This home is located at 2514 N Colpien Rd Unit A, Tulare, CA 93274 and is currently estimated at $534,431, approximately $319 per square foot. 2514 N Colpien Rd Unit A is a home located in Tulare County with nearby schools including Oak Valley Elementary School, Tulare Western High School, and St. Aloysius School.
Ownership History
Date
Name
Owned For
Owner Type
Purchase Details
Closed on
Oct 13, 2021
Sold by
Silva Armando A and Silva Susan I
Bought by
Meneses Joshua Allen and Meneses Deodete Maria
Current Estimated Value
Home Financials for this Owner
Home Financials are based on the most recent Mortgage that was taken out on this home.
Original Mortgage
$395,250
Outstanding Balance
$361,519
Interest Rate
3.01%
Mortgage Type
New Conventional
Estimated Equity
$172,912
Purchase Details
Closed on
Nov 9, 2011
Sold by
Valadoa Manuel M
Bought by
Silva Armando A and Silva Susan I
Home Financials for this Owner
Home Financials are based on the most recent Mortgage that was taken out on this home.
Original Mortgage
$70,000
Interest Rate
3.87%
Mortgage Type
New Conventional
Purchase Details
Closed on
Jul 6, 2010
Sold by
Valadoa Manuel M
Bought by
Silva Armando A and Silva Susan I
Create a Home Valuation Report for This Property
The Home Valuation Report is an in-depth analysis detailing your home's value as well as a comparison with similar homes in the area
Home Values in the Area
Average Home Value in this Area
Purchase History
| Date | Buyer | Sale Price | Title Company |
|---|---|---|---|
| Meneses Joshua Allen | $465,000 | Stewart Title Of Ca Inc | |
| Silva Armando A | -- | Chicago Title Company | |
| Silva Armando A | -- | None Available |
Source: Public Records
Mortgage History
| Date | Status | Borrower | Loan Amount |
|---|---|---|---|
| Open | Meneses Joshua Allen | $395,250 | |
| Previous Owner | Silva Armando A | $70,000 |
Source: Public Records
Tax History Compared to Growth
Tax History
| Year | Tax Paid | Tax Assessment Tax Assessment Total Assessment is a certain percentage of the fair market value that is determined by local assessors to be the total taxable value of land and additions on the property. | Land | Improvement |
|---|---|---|---|---|
| 2025 | $5,293 | $493,461 | $95,508 | $397,953 |
| 2024 | $5,293 | $483,786 | $93,636 | $390,150 |
| 2023 | $5,157 | $474,300 | $91,800 | $382,500 |
| 2022 | $1,492 | $136,518 | $36,789 | $99,729 |
| 2021 | $1,473 | $133,842 | $36,068 | $97,774 |
| 2020 | $1,497 | $132,469 | $35,698 | $96,771 |
| 2019 | $1,535 | $129,872 | $34,998 | $94,874 |
| 2018 | $1,510 | $127,326 | $34,312 | $93,014 |
| 2017 | $1,496 | $124,829 | $33,639 | $91,190 |
| 2016 | $1,431 | $122,381 | $32,979 | $89,402 |
| 2015 | $1,383 | $120,543 | $32,484 | $88,059 |
| 2014 | $1,383 | $118,182 | $31,848 | $86,334 |
Source: Public Records
Map
Nearby Homes
- 1695 Cochran Ave
- 1800 W Merritt Ave
- 2157 Country View Ave
- 2292 Anderson Ave
- 1721 Cotton Ct
- 844 Scarlet Oak Ct Unit 23 Wo
- 852 Scarlet Oak Ct Unit 22 Wo
- 1908 Scarlet Oak Ct Unit 18 Wo
- 852 Scarlet Oak Ct
- 1908 Scarlet Oak Ct
- 866 Scarlet Oak Ct
- 844 Scarlet Oak Ct
- 1901 Oak Creek Ct Unit 28 Wo
- 1913 Oak Creek Ct Unit 27 Wo
- 1929 Oak Creek Ct Unit 26 Wo
- 830 Scarlet Oak Ct Unit 24 Wo
- 830 Scarlet Oak Ct
- 1913 Oak Creek Ct
- 1901 Oak Creek Ct
- 1929 Oak Creek Ct
- 3514 N Colpien Rd
- 3476 N Colpien Rd
- 3760 N Colpien Rd
- 3760 Road 80
- 3239 N Enterprise St
- 3177 W Cartmill Ave
- 3145 W Cartmill Ave
- 4353 N Colpien Rd
- 4247 N Enterprise St
- 3015 W Cartmill Ave
- 4221 N Enterprise St
- 4195 N Enterprise St
- 2815 W Cartmill Ave
- 25615 Road 80
- 4283 N Enterprise St
- 2702 W Cartmill Ave
- 3097 W Cartmill Ave
- 4339 N Enterprise St
- 7879 Avenue 248
- 4361 N Enterprise St