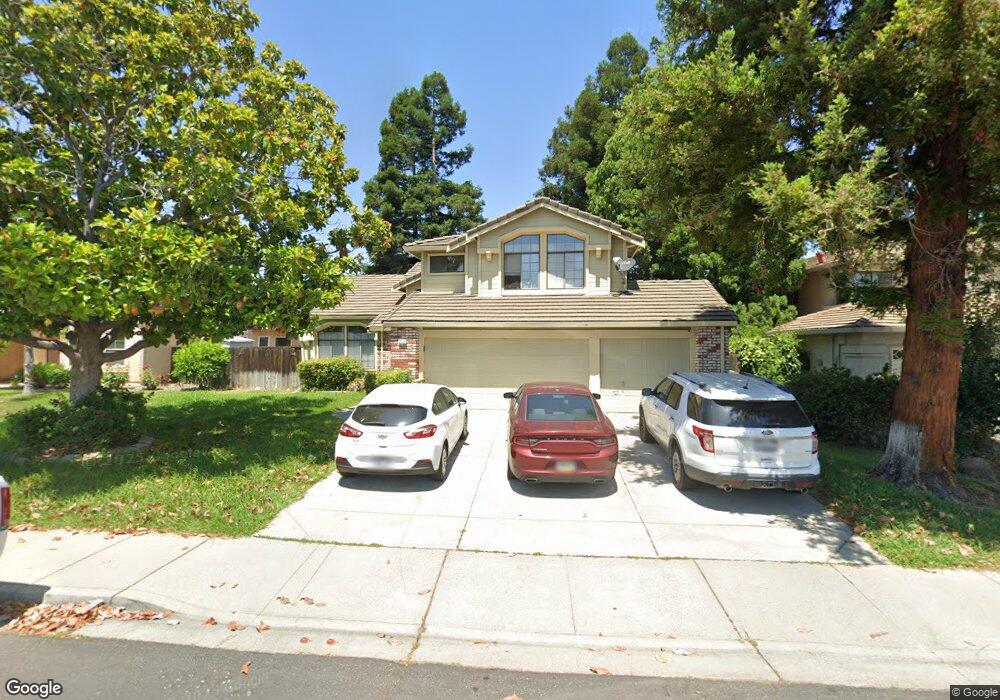
2515 Asilomar Dr Antioch, CA 94531
Deer Valley NeighborhoodEstimated Value: $548,000 - $629,000
4
Beds
3
Baths
1,830
Sq Ft
$325/Sq Ft
Est. Value
About This Home
This home is located at 2515 Asilomar Dr, Antioch, CA 94531 and is currently estimated at $595,410, approximately $325 per square foot. 2515 Asilomar Dr is a home located in Contra Costa County with nearby schools including Jack London Elementary School, Black Diamond Middle School, and Deer Valley High School.
Ownership History
Date
Name
Owned For
Owner Type
Purchase Details
Closed on
Mar 14, 2011
Sold by
Jewell David R and Jewell Aurelia A
Bought by
Yuan Hongping H and Yang Danhong
Current Estimated Value
Home Financials for this Owner
Home Financials are based on the most recent Mortgage that was taken out on this home.
Original Mortgage
$138,750
Outstanding Balance
$96,095
Interest Rate
4.96%
Mortgage Type
New Conventional
Estimated Equity
$499,315
Purchase Details
Closed on
Dec 27, 2001
Sold by
Jewell David R and Jewell Aurelia A
Bought by
Jewell David R and Jewell Aurelia A
Home Financials for this Owner
Home Financials are based on the most recent Mortgage that was taken out on this home.
Original Mortgage
$252,450
Interest Rate
8.99%
Mortgage Type
Purchase Money Mortgage
Purchase Details
Closed on
Feb 7, 1995
Sold by
Compton Terry D and Compton Wanda K
Bought by
Jewell David R and Jewell Aurelia A
Create a Home Valuation Report for This Property
The Home Valuation Report is an in-depth analysis detailing your home's value as well as a comparison with similar homes in the area
Home Values in the Area
Average Home Value in this Area
Purchase History
| Date | Buyer | Sale Price | Title Company |
|---|---|---|---|
| Yuan Hongping H | $185,000 | Fidelity National Title Co | |
| Jewell David R | -- | Old Republic Title Company | |
| Jewell David R | -- | Commonwealth Land Title Ins |
Source: Public Records
Mortgage History
| Date | Status | Borrower | Loan Amount |
|---|---|---|---|
| Open | Yuan Hongping H | $138,750 | |
| Previous Owner | Jewell David R | $252,450 |
Source: Public Records
Tax History Compared to Growth
Tax History
| Year | Tax Paid | Tax Assessment Tax Assessment Total Assessment is a certain percentage of the fair market value that is determined by local assessors to be the total taxable value of land and additions on the property. | Land | Improvement |
|---|---|---|---|---|
| 2025 | $3,021 | $237,004 | $67,255 | $169,749 |
| 2024 | $2,910 | $232,358 | $65,937 | $166,421 |
| 2023 | $2,910 | $227,803 | $64,645 | $163,158 |
| 2022 | $2,869 | $223,337 | $63,378 | $159,959 |
| 2021 | $2,782 | $218,959 | $62,136 | $156,823 |
| 2019 | $2,706 | $212,466 | $60,294 | $152,172 |
| 2018 | $2,605 | $208,301 | $59,112 | $149,189 |
| 2017 | $2,546 | $204,217 | $57,953 | $146,264 |
| 2016 | $2,474 | $200,214 | $56,817 | $143,397 |
| 2015 | $2,701 | $197,208 | $55,964 | $141,244 |
| 2014 | $3,462 | $193,346 | $54,868 | $138,478 |
Source: Public Records
Map
Nearby Homes
- 4437 Buckskin Dr
- 2640 Point Andrus Ct
- 4529 Pronghorn Way
- 2705 Asilomar Dr
- 4632 Country Hills Dr
- 4101 Galenez Way
- 4305 Calsite Ct
- 4528 Fallow Way
- 2508 Larch Way
- 4437 Deerfield Dr
- 4420 Wolverine Way
- 4442 Deerfield Dr
- 2101 Asilomar Dr
- 2829 Morro Dr
- 4030 Sheffield Dr
- 4008 Galenez Way
- 4204 Limestone Dr
- 2201 Mark Twain Dr
- 2205 Mark Twain Dr
- 2912 Morro Dr
- 2511 Asilomar Dr
- 2519 Asilomar Dr
- 2438 Whitetail Dr
- 2508 Brocket Ct
- 2507 Asilomar Dr
- 2516 Asilomar Dr
- 2520 Asilomar Dr
- 2504 Brocket Ct
- 2512 Asilomar Dr
- 2508 Asilomar Dr
- 2445 Whitetail Dr
- 2430 Whitetail Dr
- 2441 Whitetail Dr
- 2500 Brocket Ct
- 2437 Whitetail Dr
- 2504 Asilomar Dr
- 2431 Asilomar Dr
- 2424 Whitetail Dr
- 2501 Whitetail Dr