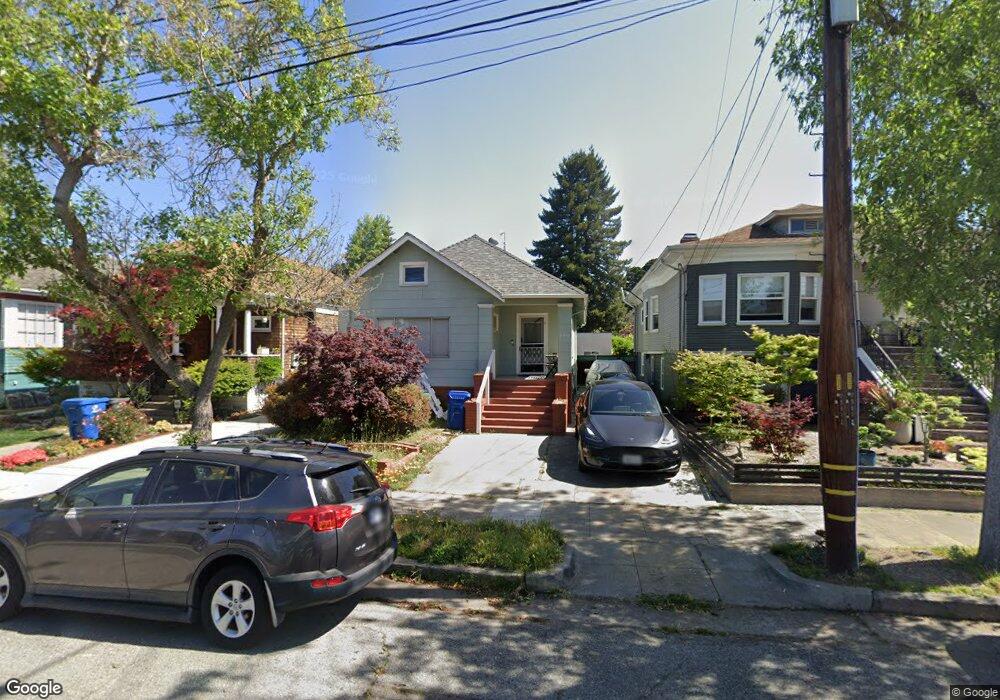
2515 Chester St Alameda, CA 94501
Downtown Alameda NeighborhoodEstimated Value: $839,000 - $1,030,000
2
Beds
1
Bath
1,096
Sq Ft
$873/Sq Ft
Est. Value
About This Home
This home is located at 2515 Chester St, Alameda, CA 94501 and is currently estimated at $956,533, approximately $872 per square foot. 2515 Chester St is a home located in Alameda County with nearby schools including Edison Elementary School, Lincoln Middle School, and Alameda High School.
Ownership History
Date
Name
Owned For
Owner Type
Purchase Details
Closed on
Mar 29, 2021
Sold by
Cheung Chi Fai and Wong Sylvia Tuy
Bought by
Cheung Chi Fai and Cheung Dickson Chi Fai
Current Estimated Value
Purchase Details
Closed on
Dec 21, 2020
Sold by
Cheung Chi Fai and Wong Sylvia Tuy
Bought by
Cheung Dickson Chi Fai and Wong Sylvia Tuy
Home Financials for this Owner
Home Financials are based on the most recent Mortgage that was taken out on this home.
Original Mortgage
$350,000
Outstanding Balance
$313,255
Interest Rate
3%
Mortgage Type
New Conventional
Estimated Equity
$643,278
Purchase Details
Closed on
Jul 6, 1998
Sold by
Schaening Margot U Trust and Margot U
Bought by
Cheung Chi Fai and Wong Sylvia Tuy
Home Financials for this Owner
Home Financials are based on the most recent Mortgage that was taken out on this home.
Original Mortgage
$187,000
Interest Rate
7.03%
Create a Home Valuation Report for This Property
The Home Valuation Report is an in-depth analysis detailing your home's value as well as a comparison with similar homes in the area
Home Values in the Area
Average Home Value in this Area
Purchase History
We collect this data history from publicly available records. To have your information removed, we recommend requesting removal directly through your county’s website.
| Date | Buyer | Sale Price | Title Company |
|---|---|---|---|
| Cheung Chi Fai | -- | None Available | |
| Cheung Dickson Chi Fai | -- | First American Title Ins Co | |
| Cheung Chi Fai | $220,000 | First American Title Guarant |
Source: Public Records
Mortgage History
We collect this data history from publicly available records. To have your information removed, we recommend requesting removal directly through your county’s website.
| Date | Status | Borrower | Loan Amount |
|---|---|---|---|
| Open | Cheung Dickson Chi Fai | $350,000 | |
| Closed | Cheung Chi Fai | $187,000 |
Source: Public Records
Tax History
| Year | Tax Paid | Tax Assessment Tax Assessment Total Assessment is a certain percentage of the fair market value that is determined by local assessors to be the total taxable value of land and additions on the property. | Land | Improvement |
|---|---|---|---|---|
| 2025 | $5,854 | $337,875 | $103,462 | $241,413 |
| 2024 | $5,854 | $331,115 | $101,434 | $236,681 |
| 2023 | $5,649 | $331,487 | $99,446 | $232,041 |
| 2022 | $5,528 | $317,987 | $97,496 | $227,491 |
| 2021 | $5,402 | $311,617 | $95,585 | $223,032 |
| 2020 | $5,337 | $315,350 | $94,605 | $220,745 |
| 2019 | $4,943 | $309,167 | $92,750 | $216,417 |
| 2018 | $4,825 | $303,107 | $90,932 | $212,175 |
| 2017 | $4,626 | $297,164 | $89,149 | $208,015 |
| 2016 | $4,616 | $291,338 | $87,401 | $203,937 |
| 2015 | $4,595 | $286,963 | $86,089 | $200,874 |
| 2014 | $4,409 | $281,341 | $84,402 | $196,939 |
Source: Public Records
Map
Nearby Homes
- 2515 Central Ave Unit 102
- 2608 Central Ave
- 1415 Broadway
- 2517 Webb Ave
- 1219 Pearl St
- 2615 San Jose Ave Unit B
- 1376 Versailles Ave
- 1125 Versailles Ave
- 2242 Santa Clara Ave
- 976 Park St
- 892 Laurel St
- 954 Park St
- 2516 Calhoun St
- 1420 Mound St
- 1817 Everett St
- 3103 Central Ave
- 1901 Everett St
- 2133 Santa Clara Ave Unit 217
- 1033 Fountain St
- 905 Del Mar Ave
Your Personal Tour Guide
Ask me questions while you tour the home.