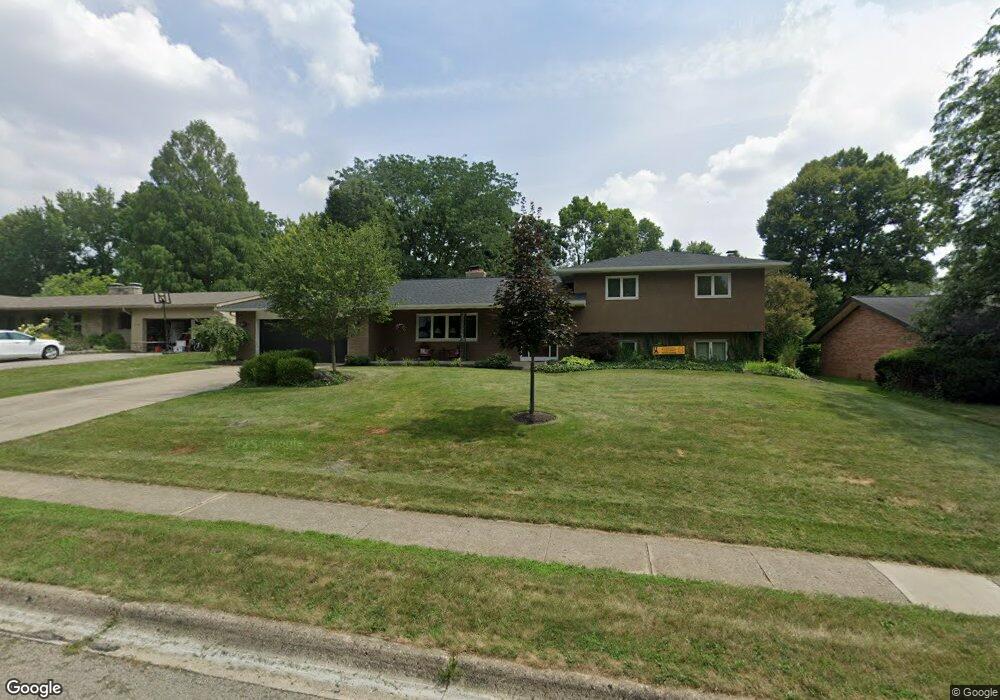
2515 Lytham Rd Columbus, OH 43220
Estimated Value: $697,685 - $765,000
4
Beds
3
Baths
2,421
Sq Ft
$302/Sq Ft
Est. Value
About This Home
This home is located at 2515 Lytham Rd, Columbus, OH 43220 and is currently estimated at $730,671, approximately $301 per square foot. 2515 Lytham Rd is a home located in Franklin County with nearby schools including Windermere Elementary School, Hastings Middle School, and Upper Arlington High School.
Ownership History
Date
Name
Owned For
Owner Type
Purchase Details
Closed on
Oct 26, 2010
Sold by
Langworthy Craig and Langworthy Jane
Bought by
Burke Jeffrey M and Burke Sarah E
Current Estimated Value
Home Financials for this Owner
Home Financials are based on the most recent Mortgage that was taken out on this home.
Original Mortgage
$309,150
Outstanding Balance
$201,180
Interest Rate
4.31%
Mortgage Type
New Conventional
Estimated Equity
$529,491
Purchase Details
Closed on
Jan 18, 2007
Sold by
Langworthy Craig
Bought by
Langworthy Craig
Purchase Details
Closed on
Jun 5, 2003
Sold by
Mitchell Leonard D and Mitchell Theodora E
Bought by
Langworthy Craig
Home Financials for this Owner
Home Financials are based on the most recent Mortgage that was taken out on this home.
Original Mortgage
$239,400
Interest Rate
5.36%
Mortgage Type
Purchase Money Mortgage
Purchase Details
Closed on
Jul 11, 1972
Bought by
Mitchell Leonard D
Create a Home Valuation Report for This Property
The Home Valuation Report is an in-depth analysis detailing your home's value as well as a comparison with similar homes in the area
Home Values in the Area
Average Home Value in this Area
Purchase History
We collect this data history from publicly available records. To have your information removed, we recommend requesting removal directly through your county’s website.
| Date | Buyer | Sale Price | Title Company |
|---|---|---|---|
| Burke Jeffrey M | $343,500 | Real Living | |
| Langworthy Craig | -- | None Available | |
| Langworthy Craig | $252,000 | -- | |
| Mitchell Leonard D | -- | -- |
Source: Public Records
Mortgage History
We collect this data history from publicly available records. To have your information removed, we recommend requesting removal directly through your county’s website.
| Date | Status | Borrower | Loan Amount |
|---|---|---|---|
| Open | Burke Jeffrey M | $309,150 | |
| Closed | Langworthy Craig | $239,400 |
Source: Public Records
Tax History
| Year | Tax Paid | Tax Assessment Tax Assessment Total Assessment is a certain percentage of the fair market value that is determined by local assessors to be the total taxable value of land and additions on the property. | Land | Improvement |
|---|---|---|---|---|
| 2025 | $11,195 | $193,380 | $86,560 | $106,820 |
| 2024 | $11,195 | $193,380 | $86,560 | $106,820 |
| 2023 | $11,057 | $193,375 | $86,555 | $106,820 |
| 2022 | $11,577 | $163,530 | $62,270 | $101,260 |
| 2021 | $10,115 | $163,530 | $62,270 | $101,260 |
| 2020 | $10,026 | $163,530 | $62,270 | $101,260 |
| 2019 | $9,534 | $137,490 | $62,270 | $75,220 |
| 2018 | $8,788 | $137,490 | $62,270 | $75,220 |
| 2017 | $8,781 | $137,490 | $62,270 | $75,220 |
| 2016 | $8,102 | $122,540 | $40,320 | $82,220 |
| 2015 | $8,095 | $122,540 | $40,320 | $82,220 |
| 2014 | $8,104 | $122,540 | $40,320 | $82,220 |
| 2013 | $3,869 | $111,370 | $36,645 | $74,725 |
Source: Public Records
Map
Nearby Homes
- 3870 Norbrook Dr
- 2290 Middlesex Rd
- 2475 Mccoy Rd
- 2690 Donna Dr
- 2681 Donna Dr
- 3950 Riverside Dr
- 2772 Scioto Villas Dr
- 2774 Scioto Villas Dr
- 2771 Scioto Villas Dr
- 2773 Scioto Villas Dr
- 2787 Scioto Villas Dr
- 2458 Edgevale Rd
- 2785 Scioto Villas Dr
- 2792 Stratford Dr
- 4304 Braunton Rd
- 2451 Edgevale Rd
- 4370 Harborough Rd
- 2676 Alliston Ct
- 2418 Cranford Rd
- 2257 Fishinger Rd
- 2501 Lytham Rd
- 2525 Lytham Rd
- 2512 Johnston Rd
- 2526 Johnston Rd
- 2487 Lytham Rd
- 2500 Johnston Rd
- 2516 Lytham Rd
- 2540 Johnston Rd
- 4006 Kioka Ave
- 4020 Kioka Ave
- 2500 Lytham Rd
- 2528 Lytham Rd
- 2490 Johnston Rd
- 2477 Lytham Rd
- 2488 Lytham Rd
- 2554 Johnston Rd
- 4040 Kioka Ave
- 2511 Johnston Rd
- 2480 Johnston Rd
- 2478 Lytham Rd
Your Personal Tour Guide
Ask me questions while you tour the home.