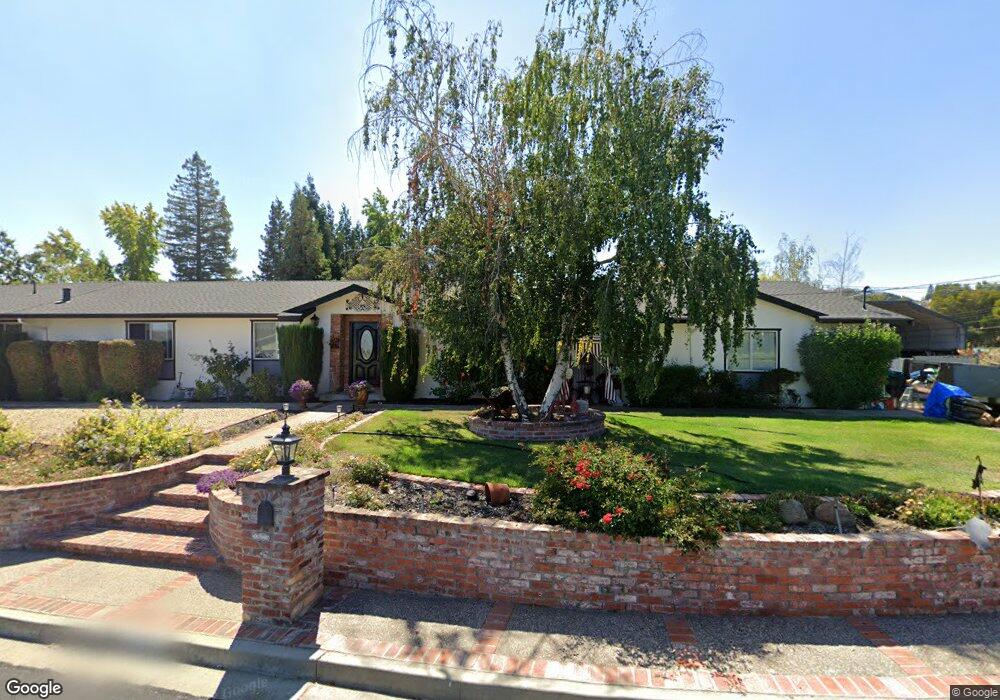
2515 Pebble Beach Loop Lafayette, CA 94549
Estimated Value: $1,205,142 - $1,634,000
4
Beds
2
Baths
2,062
Sq Ft
$700/Sq Ft
Est. Value
About This Home
This home is located at 2515 Pebble Beach Loop, Lafayette, CA 94549 and is currently estimated at $1,442,786, approximately $699 per square foot. 2515 Pebble Beach Loop is a home located in Contra Costa County with nearby schools including Valhalla Elementary School, Valley View Middle School, and College Park High School.
Create a Home Valuation Report for This Property
The Home Valuation Report is an in-depth analysis detailing your home's value as well as a comparison with similar homes in the area
Tax History
| Year | Tax Paid | Tax Assessment Tax Assessment Total Assessment is a certain percentage of the fair market value that is determined by local assessors to be the total taxable value of land and additions on the property. | Land | Improvement |
|---|---|---|---|---|
| 2025 | $5,007 | $363,185 | $113,892 | $249,293 |
| 2024 | $4,695 | $356,064 | $111,659 | $244,405 |
| 2023 | $4,695 | $349,083 | $109,470 | $239,613 |
| 2022 | $4,617 | $342,239 | $107,324 | $234,915 |
| 2021 | $4,514 | $335,529 | $105,220 | $230,309 |
| 2019 | $4,389 | $325,579 | $102,100 | $223,479 |
| 2018 | $4,192 | $319,197 | $100,099 | $219,098 |
| 2017 | $4,115 | $312,939 | $98,137 | $214,802 |
| 2016 | $3,828 | $306,804 | $96,213 | $210,591 |
| 2015 | $3,778 | $302,196 | $94,768 | $207,428 |
| 2014 | $3,707 | $296,277 | $92,912 | $203,365 |
Source: Public Records
Map
Nearby Homes
- 657 Byrdee Way
- 407 Roanoke Dr
- 203 Virginia Cir
- 222 Donegal Way
- 61 Banbridge Place
- 966 Oak Vista Ct
- 241 Blue Ridge Dr
- 1239 Sunrise Ridge Dr
- 11 Paddock Ct
- 12 Paddock Ct
- 10 Pomfret Walk Unit 11
- 120 Arbor View Ln
- 834 Carter Acres Ln
- 137 Haslemere Ct
- 120 Haslemere Ct
- 14 Heritage Oaks Rd
- 3284 Surmont Dr
- 160 Southwind Dr
- 726 Grayson Rd
- 391 Ridgeview Dr
- 2525 Pebble Beach Loop
- 2 Smoketree Ct
- 2518 Pebble Beach Loop
- 6 Smoketree Ct
- 2512 Pebble Beach Loop
- 2531 Pebble Beach Loop
- 2524 Pebble Beach Loop
- 2506 Pebble Beach Loop
- 2530 Pebble Beach Loop
- 10 Smoketree Ct
- 2537 Pebble Beach Loop
- 2500 Pebble Beach Loop
- 2536 Pebble Beach Loop
- 1 Smoketree Ct
- 713 Wee Donegal
- 5 Smoketree Ct
- 2565 Pebble Beach Loop
- 2494 Pebble Beach Loop
- 709 Wee Donegal
- 2571 Pebble Beach Loop
Your Personal Tour Guide
Ask me questions while you tour the home.