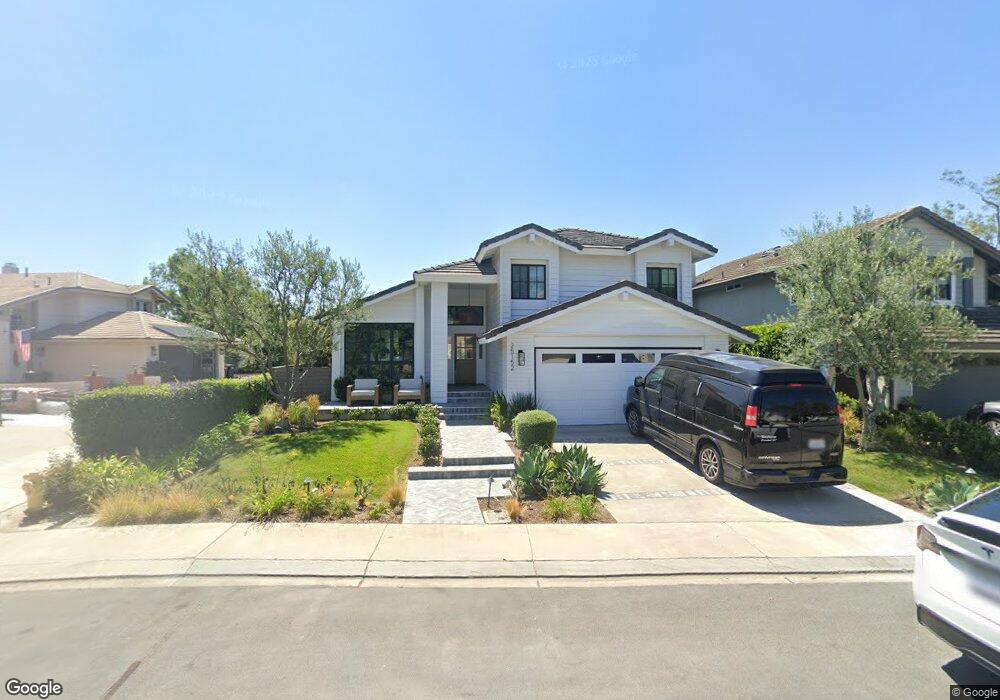
25152 Danabirch Dana Point, CA 92629
Dana Hills NeighborhoodEstimated Value: $1,735,595 - $1,976,000
4
Beds
3
Baths
2,092
Sq Ft
$894/Sq Ft
Est. Value
About This Home
This home is located at 25152 Danabirch, Dana Point, CA 92629 and is currently estimated at $1,870,899, approximately $894 per square foot. 25152 Danabirch is a home located in Orange County with nearby schools including Del Obispo Elementary School, Marco Forster Middle School, and Dana Hills High School.
Ownership History
Date
Name
Owned For
Owner Type
Purchase Details
Closed on
Nov 14, 2007
Sold by
Granese Richard
Bought by
Granese Marsha
Current Estimated Value
Home Financials for this Owner
Home Financials are based on the most recent Mortgage that was taken out on this home.
Original Mortgage
$720,000
Outstanding Balance
$470,052
Interest Rate
7.37%
Mortgage Type
New Conventional
Estimated Equity
$1,400,847
Purchase Details
Closed on
Nov 2, 2004
Sold by
The 1996 Swane Family Trust
Bought by
Granese Richard and Granese Marsha Funderburk
Home Financials for this Owner
Home Financials are based on the most recent Mortgage that was taken out on this home.
Original Mortgage
$660,000
Interest Rate
5%
Mortgage Type
Purchase Money Mortgage
Purchase Details
Closed on
May 14, 1996
Sold by
Swane Paul C and Swane Rebecca L
Bought by
Swane Paul Curtis and Swane Rebecca Louise
Create a Home Valuation Report for This Property
The Home Valuation Report is an in-depth analysis detailing your home's value as well as a comparison with similar homes in the area
Home Values in the Area
Average Home Value in this Area
Purchase History
| Date | Buyer | Sale Price | Title Company |
|---|---|---|---|
| Granese Marsha | -- | Old Republic Title Company | |
| Granese Richard | $825,000 | California Title | |
| Swane Paul Curtis | -- | -- |
Source: Public Records
Mortgage History
| Date | Status | Borrower | Loan Amount |
|---|---|---|---|
| Open | Granese Marsha | $720,000 | |
| Closed | Granese Richard | $660,000 |
Source: Public Records
Tax History
| Year | Tax Paid | Tax Assessment Tax Assessment Total Assessment is a certain percentage of the fair market value that is determined by local assessors to be the total taxable value of land and additions on the property. | Land | Improvement |
|---|---|---|---|---|
| 2025 | $11,353 | $1,149,971 | $930,007 | $219,964 |
| 2024 | $11,353 | $1,127,423 | $911,772 | $215,651 |
| 2023 | $11,112 | $1,105,317 | $893,894 | $211,423 |
| 2022 | $10,899 | $1,083,645 | $876,367 | $207,278 |
| 2021 | $10,687 | $1,062,398 | $859,184 | $203,214 |
| 2020 | $10,580 | $1,051,505 | $850,374 | $201,131 |
| 2019 | $10,627 | $1,030,888 | $833,700 | $197,188 |
| 2018 | $10,524 | $992,000 | $817,353 | $174,647 |
| 2017 | $9,603 | $916,000 | $751,815 | $164,185 |
| 2016 | $9,413 | $869,990 | $705,805 | $164,185 |
| 2015 | $9,194 | $869,990 | $705,805 | $164,185 |
| 2014 | $9,247 | $869,990 | $705,805 | $164,185 |
Source: Public Records
Map
Nearby Homes
- 7 Tattersall
- 32921 Danaoak
- 33142 Sea Lion Dr
- 31 La Paloma
- 25262 Brigantine Dr
- 33211 Blue Fin Dr
- 5 Old Ranch Rd
- 32791 Del Obispo St
- 33042 Palo Alto St
- 33231 Big Sur St
- 33072 Ocean Ridge
- 33121 Ocean Ridge
- 33162 Paseo Pinto
- 33041 Lighthouse Ct
- 33371 Cheltam Way Unit 3
- 33371 Cheltam Way Unit 2
- 24751 Camarillo St
- 11 Placid Harbor
- 2 Point Catalina
- 1 Baycrest Place
- 25142 Danabirch
- 25162 Danabirch
- 25172 Danabirch
- 32862 Danapoplar
- 32872 Danapoplar
- 32852 Danapoplar
- 25174 Danabirch
- 32882 Danapoplar
- 25151 Danabirch
- 25141 Danabirch
- 25161 Danabirch
- 25176 Danabirch
- 32884 Danapoplar
- 25122 Danabirch
- 25178 Danabirch
- 25121 Danabirch
- 32886 Danapoplar
- 32861 Danapoplar
- 25121 Danacoral
- 32851 Danapoplar
Your Personal Tour Guide
Ask me questions while you tour the home.