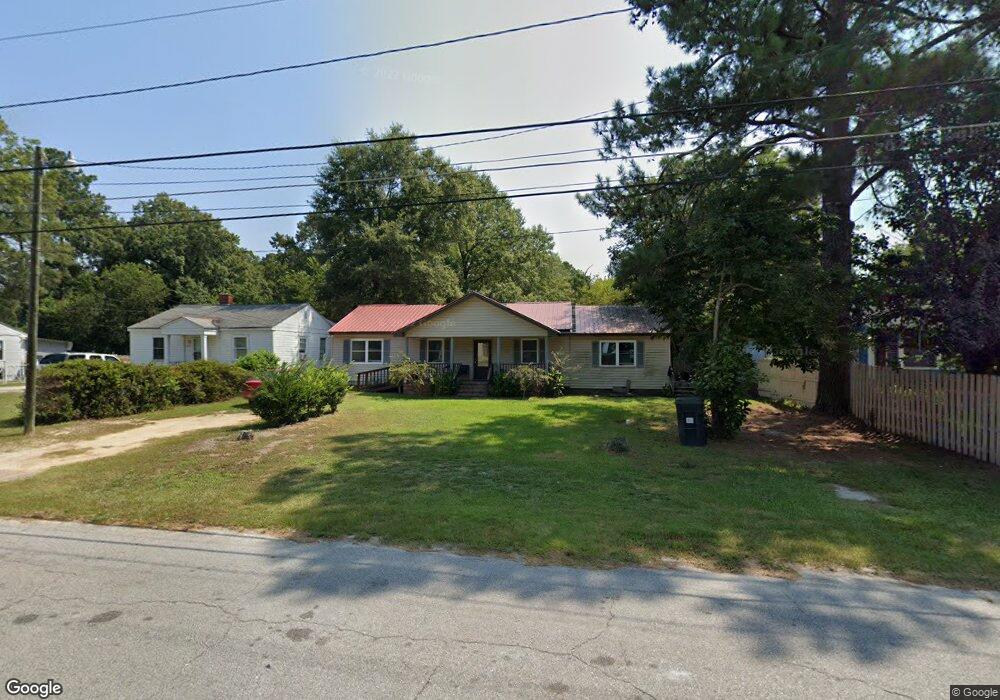
2516 Coleman Ave Augusta, GA 30906
Old Savannah NeighborhoodEstimated Value: $100,000 - $146,000
3
Beds
3
Baths
1,657
Sq Ft
$80/Sq Ft
Est. Value
About This Home
This home is located at 2516 Coleman Ave, Augusta, GA 30906 and is currently estimated at $132,275, approximately $79 per square foot. 2516 Coleman Ave is a home located in Richmond County with nearby schools including Hains Elementary School, Richmond Hill K-8, and Johnson Magnet.
Ownership History
Date
Name
Owned For
Owner Type
Purchase Details
Closed on
Oct 16, 2007
Sold by
Winfrey Sandra and Winfrey Ronald
Bought by
Wimbush Virgil and Wimbush Philandis
Current Estimated Value
Purchase Details
Closed on
Jan 29, 1996
Sold by
Buck Elizabeth R
Bought by
Winfery Ronald W Winfery Sandra M
Purchase Details
Closed on
Dec 1, 1995
Sold by
Buck Elizabeth R
Bought by
Winfery Ronald W
Purchase Details
Closed on
Feb 28, 1995
Sold by
Buck Elizabeth R
Bought by
Winfrey Ronald Winfrey Sandra
Purchase Details
Closed on
Feb 20, 1995
Sold by
Buck Elizabeth R
Bought by
Winfrey Ronald
Create a Home Valuation Report for This Property
The Home Valuation Report is an in-depth analysis detailing your home's value as well as a comparison with similar homes in the area
Home Values in the Area
Average Home Value in this Area
Purchase History
| Date | Buyer | Sale Price | Title Company |
|---|---|---|---|
| Wimbush Virgil | -- | None Available | |
| Winfery Ronald W Winfery Sandra M | -- | -- | |
| Winfery Ronald W | -- | -- | |
| Winfrey Ronald Winfrey Sandra | -- | -- | |
| Winfrey Ronald | $55,000 | -- |
Source: Public Records
Tax History
| Year | Tax Paid | Tax Assessment Tax Assessment Total Assessment is a certain percentage of the fair market value that is determined by local assessors to be the total taxable value of land and additions on the property. | Land | Improvement |
|---|---|---|---|---|
| 2025 | $470 | $49,952 | $4,320 | $45,632 |
| 2024 | $470 | $52,064 | $4,320 | $47,744 |
| 2023 | $406 | $49,736 | $4,320 | $45,416 |
| 2022 | $396 | $34,679 | $4,320 | $30,359 |
| 2021 | $396 | $27,707 | $4,320 | $23,387 |
| 2020 | $396 | $27,707 | $4,320 | $23,387 |
| 2019 | $396 | $27,707 | $4,320 | $23,387 |
| 2018 | $396 | $27,707 | $4,320 | $23,387 |
| 2017 | $1,243 | $27,707 | $4,320 | $23,387 |
| 2016 | $1,219 | $26,948 | $4,320 | $22,628 |
| 2015 | $1,269 | $26,948 | $4,320 | $22,628 |
| 2014 | $1,228 | $26,948 | $4,320 | $22,628 |
Source: Public Records
Map
Nearby Homes
- 2018 Chester Ave
- 2021 Virginia Ave
- 1895 Virginia Ave
- 2487 Reese Ave
- 2475 Reese Ave
- 2472 Reese Ave
- 2440 Peach Orchard Rd
- 2469 Reese Ave
- 2437 Mike Padgett Hwy
- 2205 Bandler Rd
- 2551 Kaufman Dr
- 2118 Sanders Rd
- 2137 Gatewood Dr
- 2424 Bream Ave
- 2321 Old Savannah Rd
- 2225 Martin Rd
- 2232 Bandler Rd
- 2204 Sandra Ct
- 1825 Medlar St
- 2537 Sandra Dr
- 2514 Coleman Ave
- 2518 Coleman Ave
- 2512 Coleman Ave
- 2520 Coleman Ave
- 2513 Reese Ave
- 2515 Reese Ave
- 2511 Reese Ave
- 2511 Coleman Ave
- 2517 Reese Ave
- 2509 Reese Ave
- 2513 Coleman Ave
- 2510 Coleman Ave
- 2515 Coleman Ave
- 2522 Coleman Ave
- 2519 Reese Ave
- 2507 Reese Ave
- 2509 Coleman Ave
- 2508 Coleman Ave
- 2521 Reese Ave
- 2505 Reese Ave
Your Personal Tour Guide
Ask me questions while you tour the home.