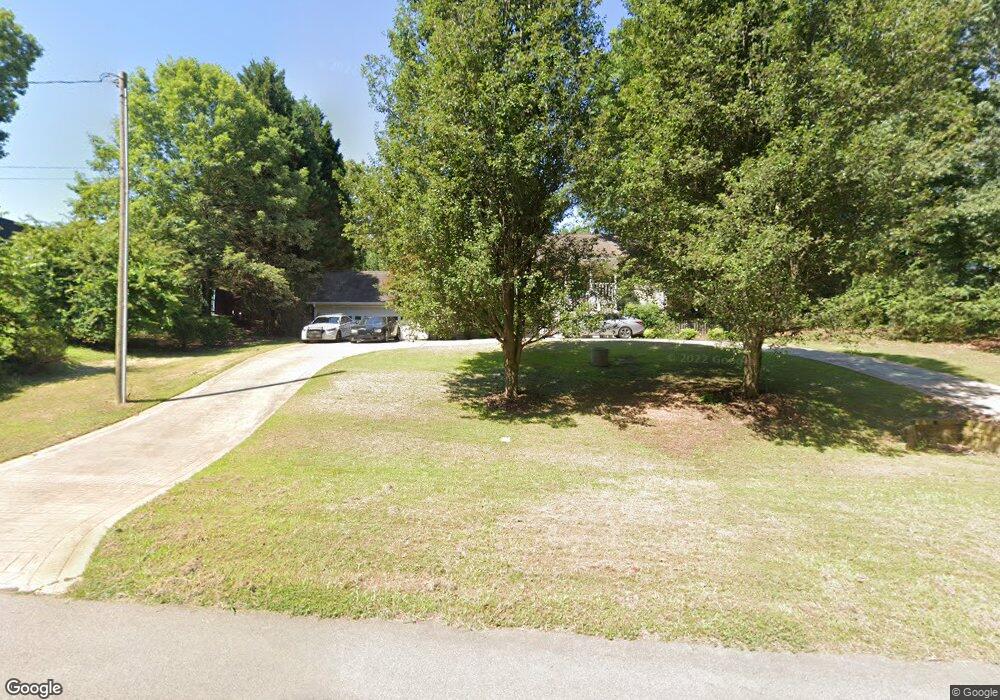
2516 Venture Cir Gainesville, GA 30506
Estimated Value: $328,989 - $419,000
3
Beds
2
Baths
1,537
Sq Ft
$233/Sq Ft
Est. Value
About This Home
This home is located at 2516 Venture Cir, Gainesville, GA 30506 and is currently estimated at $358,747, approximately $233 per square foot. 2516 Venture Cir is a home located in Hall County with nearby schools including Sardis Elementary School, Cartersville Primary School, and Chestatee Middle School.
Ownership History
Date
Name
Owned For
Owner Type
Purchase Details
Closed on
Jul 15, 2019
Sold by
Holcomb Shane M
Bought by
Holcomb Kathryn D
Current Estimated Value
Home Financials for this Owner
Home Financials are based on the most recent Mortgage that was taken out on this home.
Original Mortgage
$80,000
Outstanding Balance
$51,060
Interest Rate
3.82%
Mortgage Type
New Conventional
Estimated Equity
$307,687
Purchase Details
Closed on
Feb 3, 2000
Sold by
Harrison Allen F
Bought by
Holcomb Shane M and Holcomb Kathryn D
Home Financials for this Owner
Home Financials are based on the most recent Mortgage that was taken out on this home.
Original Mortgage
$112,550
Interest Rate
8.11%
Mortgage Type
FHA
Purchase Details
Closed on
Feb 1, 2000
Sold by
Harrison Sharon E
Bought by
Harrison Allen F
Home Financials for this Owner
Home Financials are based on the most recent Mortgage that was taken out on this home.
Original Mortgage
$112,550
Interest Rate
8.11%
Mortgage Type
FHA
Create a Home Valuation Report for This Property
The Home Valuation Report is an in-depth analysis detailing your home's value as well as a comparison with similar homes in the area
Home Values in the Area
Average Home Value in this Area
Purchase History
| Date | Buyer | Sale Price | Title Company |
|---|---|---|---|
| Holcomb Kathryn D | -- | -- | |
| Holcomb Shane M | $113,200 | -- | |
| Harrison Allen F | -- | -- |
Source: Public Records
Mortgage History
| Date | Status | Borrower | Loan Amount |
|---|---|---|---|
| Open | Holcomb Kathryn D | $80,000 | |
| Previous Owner | Holcomb Shane M | $112,550 |
Source: Public Records
Tax History Compared to Growth
Tax History
| Year | Tax Paid | Tax Assessment Tax Assessment Total Assessment is a certain percentage of the fair market value that is determined by local assessors to be the total taxable value of land and additions on the property. | Land | Improvement |
|---|---|---|---|---|
| 2024 | $2,760 | $108,832 | $16,760 | $92,072 |
| 2023 | $2,611 | $102,776 | $16,760 | $86,016 |
| 2022 | $2,274 | $85,504 | $16,760 | $68,744 |
| 2021 | $1,870 | $68,464 | $5,240 | $63,224 |
| 2020 | $1,839 | $65,344 | $5,240 | $60,104 |
| 2019 | $1,734 | $60,904 | $5,240 | $55,664 |
| 2018 | $1,437 | $48,383 | $5,240 | $43,143 |
| 2017 | $1,422 | $48,383 | $5,240 | $43,143 |
| 2016 | $1,389 | $48,383 | $5,240 | $43,143 |
| 2015 | $1,400 | $48,383 | $5,240 | $43,143 |
| 2014 | $1,400 | $48,383 | $5,240 | $43,143 |
Source: Public Records
Map
Nearby Homes
- 2527 Venture Cir
- 2496 Venture Dr
- 2520 Dawsonville Hwy
- 2903 Lynncliff Dr
- 2730 & 2726 Vaughandale Cir
- 2231 Lake Ranch Ct
- 2245 Sidney Dr
- 3411 Lake Ridge Place
- 2237 Lake Ranch Ct
- 2265 Sidney Dr
- 2624 Walnut Rd
- 2650 Westview Cir
- 1 Yellow Creek
- 4060 Peregrine Way
- 0 Bethel Rd (296 128 & 296 132) Rd Unit 7681499
- 4055 Peregrine Way
- 0 Bethel Rd (296 128 & 296 132) Rd Unit 10643984
- 2667 Tammi Ln
- 3550 Dockside Shores Dr
- 3514 Dockside Shores Dr
- 0 Venture Cir Unit 8576279
- 0 Venture Cir Unit 7305600
- 0 Venture Cir Unit 7249240
- 0 Venture Cir Unit 8944073
- 0 Venture Cir Unit 2966652
- 2527 Venture Dr
- 2531 Venture Dr
- 2510 Venture Cir
- 2515 Venture Cir
- 2525 Venture Dr
- 2519 Venture Cir
- 2521 Venture Cir
- 2511 Venture Cir
- 2521 Venture Dr
- 2507 Venture Ln
- 2530 Venture Dr
- 2532 Venture Dr Unit 19
- 2532 Venture Dr
- 2506 Venture Cir
- 2620 Venture Ln