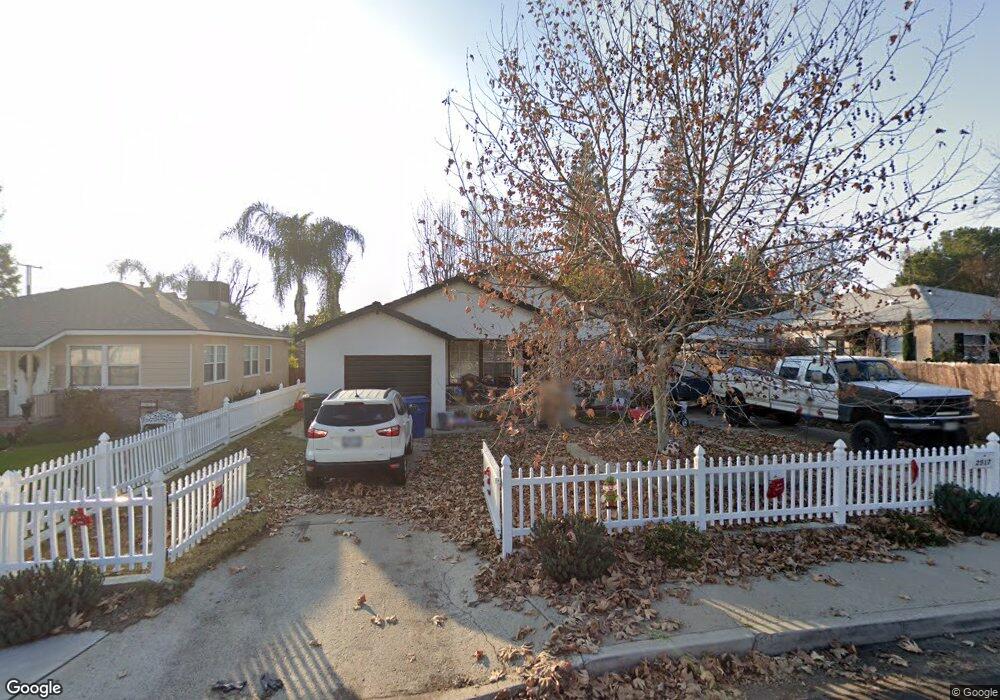
2517 Charleston Dr Bakersfield, CA 93308
North Country Meadows NeighborhoodEstimated Value: $262,000 - $295,000
3
Beds
1
Bath
1,102
Sq Ft
$252/Sq Ft
Est. Value
About This Home
This home is located at 2517 Charleston Dr, Bakersfield, CA 93308 and is currently estimated at $277,601, approximately $251 per square foot. 2517 Charleston Dr is a home located in Kern County with nearby schools including Highland Elementary School, Standard Middle School, and North High School.
Ownership History
Date
Name
Owned For
Owner Type
Purchase Details
Closed on
Feb 4, 2022
Sold by
David Wallen John
Bought by
Ramirez Miguel Angel and Delramirez Eva Del
Current Estimated Value
Purchase Details
Closed on
Jan 22, 2018
Sold by
Eugene Robert
Bought by
Wallen John David
Purchase Details
Closed on
May 14, 2013
Sold by
Morse Rachel
Bought by
Fox Robert E
Home Financials for this Owner
Home Financials are based on the most recent Mortgage that was taken out on this home.
Original Mortgage
$117,800
Interest Rate
3.79%
Mortgage Type
New Conventional
Purchase Details
Closed on
Aug 18, 2012
Sold by
Schmidt Jane and Mcginley Marilyn E
Bought by
Johnson Jason and Johnson Amy
Home Financials for this Owner
Home Financials are based on the most recent Mortgage that was taken out on this home.
Original Mortgage
$68,732
Interest Rate
3.62%
Mortgage Type
FHA
Purchase Details
Closed on
Jan 25, 1994
Sold by
Cook Wesley and Cook Grace F
Bought by
Cook Wesley and Cook Grace F
Create a Home Valuation Report for This Property
The Home Valuation Report is an in-depth analysis detailing your home's value as well as a comparison with similar homes in the area
Home Values in the Area
Average Home Value in this Area
Purchase History
| Date | Buyer | Sale Price | Title Company |
|---|---|---|---|
| Ramirez Miguel Angel | $138,000 | Wallen John David | |
| Wallen John David | $139,000 | None Available | |
| Fox Robert E | -- | Chicago Title Company | |
| Fox Robert E | $124,000 | Chicago Title Company | |
| Johnson Jason | $70,000 | Chicago Title Company | |
| Cook Wesley | -- | -- |
Source: Public Records
Mortgage History
| Date | Status | Borrower | Loan Amount |
|---|---|---|---|
| Previous Owner | Fox Robert E | $117,800 | |
| Previous Owner | Johnson Jason | $68,732 |
Source: Public Records
Tax History
| Year | Tax Paid | Tax Assessment Tax Assessment Total Assessment is a certain percentage of the fair market value that is determined by local assessors to be the total taxable value of land and additions on the property. | Land | Improvement |
|---|---|---|---|---|
| 2025 | $2,723 | $146,446 | $42,448 | $103,998 |
| 2024 | $2,632 | $143,575 | $41,616 | $101,959 |
| 2023 | $2,632 | $140,760 | $40,800 | $99,960 |
| 2022 | $2,371 | $123,420 | $30,600 | $92,820 |
| 2021 | $2,280 | $121,000 | $30,000 | $91,000 |
| 2020 | $2,280 | $138,985 | $28,019 | $110,966 |
| 2019 | $2,310 | $138,985 | $28,019 | $110,966 |
| 2018 | $2,226 | $133,590 | $26,932 | $106,658 |
| 2017 | $2,211 | $130,971 | $26,404 | $104,567 |
| 2016 | $2,033 | $128,404 | $25,887 | $102,517 |
| 2015 | $2,002 | $126,477 | $25,499 | $100,978 |
| 2014 | $1,958 | $124,000 | $25,000 | $99,000 |
Source: Public Records
Map
Nearby Homes
- 2407 Olympic Dr
- 2700 Charleston Dr
- 2320 Olympic Dr
- 200 Bedford Way
- 123 Bedford Way
- 2416 Barnett St
- 2805 Charleston Dr
- 321 Circle Dr
- 113 Circle Dr
- 104 Brighton Way
- 2301 Barnett St
- 2204 Bedford Way
- 2202 Bedford Way
- 612 China Grade Loop
- 2716 N Chester Ave
- 2800 N Chester Ave
- 2609 Manor St
- 2810 N Chester Ave
- 214 Lowell Dr
- 2104 Watson St
- 2513 Charleston Dr
- 2521 Charleston Dr
- 2509 Charleston Dr
- 2601 Charleston Dr
- 2410 Olympic Dr
- 2414 Olympic Dr
- 2408 Olympic Dr
- 2500 Olympic Dr
- 2406 Olympic Dr
- 2605 Charleston Dr
- 2505 Charleston Dr
- 10916 Charleston Dr
- 2516 Charleston Dr
- 2502 Olympic Dr
- 2512 Charleston Dr
- 2404 Olympic Dr
- 2520 Charleston Dr
- 2609 Charleston Dr
- 2600 Charleston Dr
- 2501 Charleston Dr
Your Personal Tour Guide
Ask me questions while you tour the home.