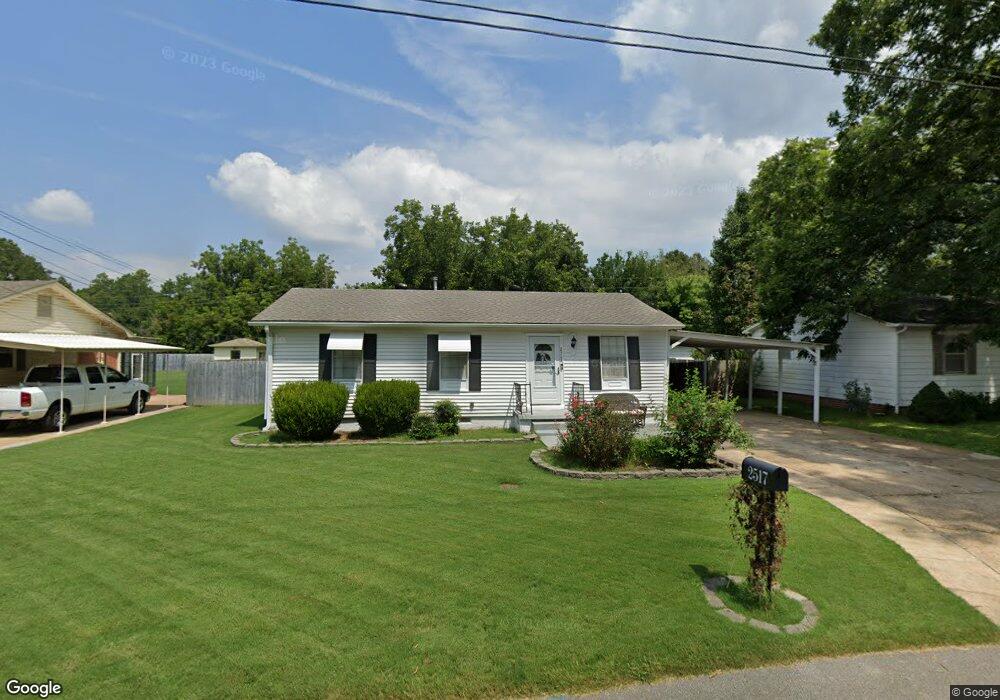
2517 Mape St Humboldt, TN 38343
Estimated Value: $75,000 - $89,000
2
Beds
1
Bath
912
Sq Ft
$91/Sq Ft
Est. Value
About This Home
This home is located at 2517 Mape St, Humboldt, TN 38343 and is currently estimated at $82,878, approximately $90 per square foot. 2517 Mape St is a home located in Gibson County with nearby schools including Stigall Primary School, East Elementary School, and Humboldt Middle School.
Ownership History
Date
Name
Owned For
Owner Type
Purchase Details
Closed on
Feb 22, 2013
Sold by
Fullbright Bobbie D
Bought by
Whitaker Chandler
Current Estimated Value
Purchase Details
Closed on
Apr 2, 2004
Sold by
Fullbright Bobbie D and Fullbright J
Bought by
Bolton Gary
Purchase Details
Closed on
Oct 19, 1998
Sold by
Sec Of Hud
Bought by
Fullbright J C Bobbie D
Purchase Details
Closed on
Jul 13, 1998
Bought by
Fullbright J C J and Fullbright Bobbie D
Purchase Details
Closed on
Apr 28, 1998
Bought by
Turner Jack T
Purchase Details
Closed on
Oct 26, 1997
Bought by
Sec Of Hud % Fed Housing Adm Ste 1200
Purchase Details
Closed on
Jan 20, 1997
Bought by
Chase Manhattan Mtg Corp
Purchase Details
Closed on
Sep 4, 1991
Bought by
Mccall Don Beth
Purchase Details
Closed on
Jun 2, 1988
Bought by
Wingham Richard S
Purchase Details
Closed on
Jan 2, 1900
Bought by
Essary Bobby C and Lori Ann
Create a Home Valuation Report for This Property
The Home Valuation Report is an in-depth analysis detailing your home's value as well as a comparison with similar homes in the area
Home Values in the Area
Average Home Value in this Area
Purchase History
| Date | Buyer | Sale Price | Title Company |
|---|---|---|---|
| Whitaker Chandler | $20,000 | -- | |
| Bolton Gary | -- | -- | |
| Fullbright J C Bobbie D | $43,900 | -- | |
| Fullbright J C J | $43,900 | -- | |
| Turner Jack T | $20,300 | -- | |
| Sec Of Hud % Fed Housing Adm Ste 1200 | $35,600 | -- | |
| Chase Manhattan Mtg Corp | $35,600 | -- | |
| Mccall Don Beth | -- | -- | |
| Wingham Richard S | -- | -- | |
| Essary Bobby C | -- | -- |
Source: Public Records
Tax History Compared to Growth
Tax History
| Year | Tax Paid | Tax Assessment Tax Assessment Total Assessment is a certain percentage of the fair market value that is determined by local assessors to be the total taxable value of land and additions on the property. | Land | Improvement |
|---|---|---|---|---|
| 2025 | $390 | $14,400 | $0 | $0 |
| 2024 | $390 | $14,400 | $3,250 | $11,150 |
| 2023 | $100 | $9,050 | $2,000 | $7,050 |
| 2022 | $93 | $9,050 | $2,000 | $7,050 |
| 2021 | $93 | $9,050 | $2,000 | $7,050 |
| 2020 | $8 | $9,050 | $2,000 | $7,050 |
| 2019 | $340 | $9,050 | $2,000 | $7,050 |
| 2018 | $315 | $7,775 | $2,000 | $5,775 |
| 2017 | $311 | $7,775 | $2,000 | $5,775 |
| 2016 | $311 | $7,775 | $2,000 | $5,775 |
| 2015 | $309 | $7,775 | $2,000 | $5,775 |
| 2014 | $309 | $7,775 | $2,000 | $5,775 |
Source: Public Records
Map
Nearby Homes
- 00000 Lot 7 Mullins St
- 0000 lot 6-C Mullins St
- 000Lot 6-B Mullins St
- 00-lot 6-A Mullins St
- 2310 Dodson St
- 0 Eastend Dr
- 2162 Dodson St
- 1338 Dungan St
- 1211 N 29th Ave
- 0 Highway 45 Bypass
- 0 Viking Dr
- 2107 Campbell St
- 1438 N 19th Ave
- 1730 Stallings Rd
- 1320 Eastview Dr
- 1416 N 18th Ave
- 3117 Laurel St
- 811 N 24th Ave
- 2508 Vine St
- 1325 N 17th Ave