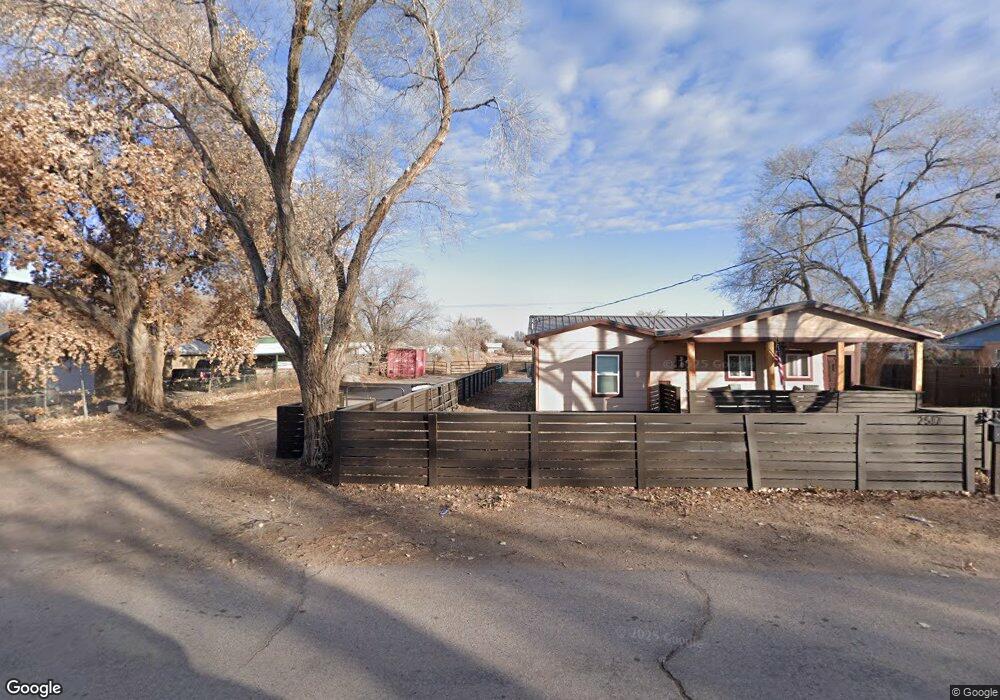
2517 Metzgar Rd SW Albuquerque, NM 87105
Estimated Value: $278,000 - $376,971
2
Beds
1
Bath
1,110
Sq Ft
$297/Sq Ft
Est. Value
About This Home
This home is located at 2517 Metzgar Rd SW, Albuquerque, NM 87105 and is currently estimated at $329,743, approximately $297 per square foot. 2517 Metzgar Rd SW is a home located in Bernalillo County with nearby schools including Navajo Elementary School, Harrison Middle School, and Rio Grande High School.
Ownership History
Date
Name
Owned For
Owner Type
Purchase Details
Closed on
May 2, 2024
Sold by
Watts Alyce M
Bought by
Padilla Christina
Current Estimated Value
Home Financials for this Owner
Home Financials are based on the most recent Mortgage that was taken out on this home.
Original Mortgage
$292,000
Outstanding Balance
$287,898
Interest Rate
6.87%
Mortgage Type
New Conventional
Estimated Equity
$41,845
Purchase Details
Closed on
Oct 29, 2020
Sold by
Fletcher Anne M
Bought by
Watts Alyce M
Purchase Details
Closed on
Jun 23, 2004
Sold by
Scanlan Wanda L
Bought by
Fletcher Anne M
Home Financials for this Owner
Home Financials are based on the most recent Mortgage that was taken out on this home.
Original Mortgage
$83,000
Interest Rate
9.1%
Mortgage Type
Purchase Money Mortgage
Create a Home Valuation Report for This Property
The Home Valuation Report is an in-depth analysis detailing your home's value as well as a comparison with similar homes in the area
Home Values in the Area
Average Home Value in this Area
Purchase History
| Date | Buyer | Sale Price | Title Company |
|---|---|---|---|
| Padilla Christina | -- | First American Title Insurance | |
| Watts Alyce M | -- | None Listed On Document | |
| Fletcher Anne M | -- | Rio Grande Title Company Inc |
Source: Public Records
Mortgage History
| Date | Status | Borrower | Loan Amount |
|---|---|---|---|
| Open | Padilla Christina | $292,000 | |
| Previous Owner | Fletcher Anne M | $83,000 |
Source: Public Records
Tax History Compared to Growth
Tax History
| Year | Tax Paid | Tax Assessment Tax Assessment Total Assessment is a certain percentage of the fair market value that is determined by local assessors to be the total taxable value of land and additions on the property. | Land | Improvement |
|---|---|---|---|---|
| 2024 | $829 | $22,331 | $3,863 | $18,468 |
| 2023 | $814 | $21,682 | $3,751 | $17,931 |
| 2022 | $766 | $21,051 | $3,642 | $17,409 |
| 2021 | $741 | $20,438 | $3,536 | $16,902 |
| 2020 | $728 | $19,843 | $3,433 | $16,410 |
| 2019 | $706 | $19,265 | $3,333 | $15,932 |
| 2018 | $702 | $19,265 | $3,333 | $15,932 |
| 2017 | $696 | $19,265 | $3,333 | $15,932 |
| 2016 | $690 | $19,265 | $3,333 | $15,932 |
| 2015 | $19,265 | $19,265 | $3,333 | $15,932 |
| 2014 | $676 | $19,233 | $4,599 | $14,634 |
| 2013 | -- | $18,673 | $4,465 | $14,208 |
Source: Public Records
Map
Nearby Homes
- 5147 Don Mariano Rd SW
- 4519 W Glen Dr SW
- 4506 W Glen Dr SW
- 2408 Alpine Rd SW
- 4320 Blumenshine Cir SW
- 3104 Lisa Rd SW
- 0 Coors Rd SW
- 3445 Gun Club Rd SW
- 3611 Gun Club Rd SW
- 7805B Coors Blvd SW
- 4625 Sunny Cir SW
- 2212 Henry Rd SW
- 3931 Anderson Farm Dr SW
- 5621 Don Lorenzo Dr SW
- 2318 Trammell Ct SW
- 2312 Trammell Ct SW
- 2327 Pajarito Rd SW
- 2306 Trammell Ct SW
- 2707 Garner Rd SW
- 0 Off Pajarito (Wf 9 11 12) Rd SW Unit 1057983
- 2517 Metzgar Rd SW
- 5002 Skyway Ct SW
- 2513 Metzgar Rd SW
- 2509 Metzgar Rd SW
- 5000 Skyway Ct SW
- 0 Bryan Ct
- 4721 Skyway Ct SW
- 2516 Metzgar Rd SW
- 2701 Metzgar Rd SW
- 2512 Metzgar Rd SW
- 4713 Skyway Ct SW
- 2520 Metzgar Rd SW
- 4709 Skyway Ct SW
- 2506 Metzgar Rd SW
- 2505 Metzgar Rd SW
- 2524 Metzgar Rd SW
- 2705 Metzgar Rd SW
- 2712 Bryan Ct SW
- 2500 Metzgar Rd SW
- 2708 Bryan Ct SW