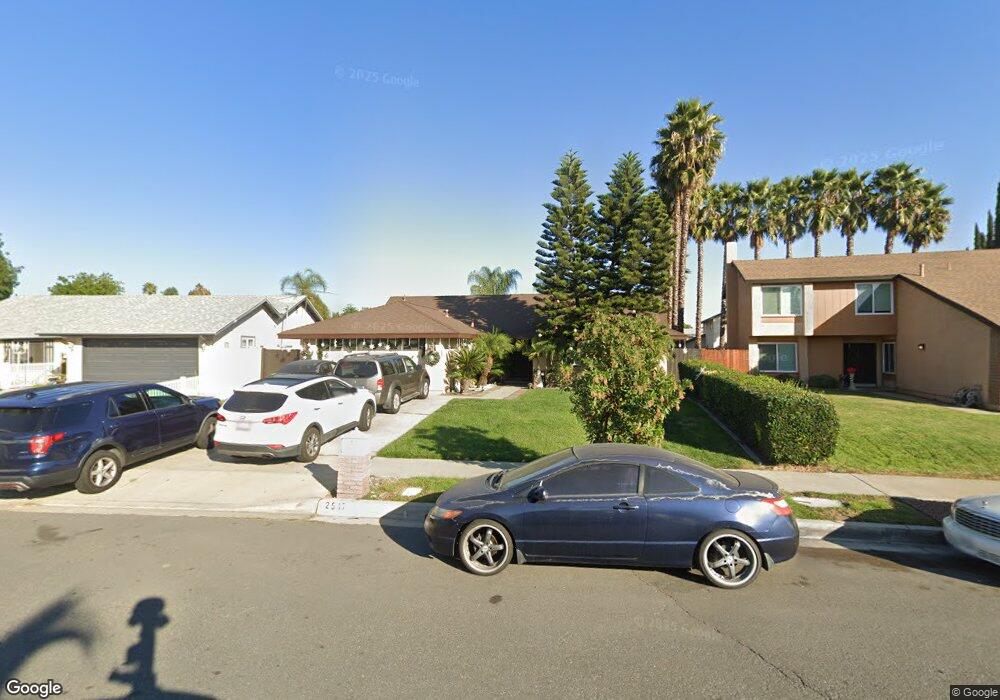
2517 S Calaveras Place Ontario, CA 91761
Ontario Ranch NeighborhoodEstimated Value: $696,310 - $725,000
3
Beds
2
Baths
1,245
Sq Ft
$571/Sq Ft
Est. Value
About This Home
This home is located at 2517 S Calaveras Place, Ontario, CA 91761 and is currently estimated at $710,828, approximately $570 per square foot. 2517 S Calaveras Place is a home located in San Bernardino County with nearby schools including Bon View Elementary, De Anza Middle, and Colony High.
Ownership History
Date
Name
Owned For
Owner Type
Purchase Details
Closed on
Jul 15, 2005
Sold by
Cabrera Patrick M
Bought by
Guevara Ignacio F
Current Estimated Value
Home Financials for this Owner
Home Financials are based on the most recent Mortgage that was taken out on this home.
Original Mortgage
$316,000
Outstanding Balance
$168,035
Interest Rate
5.95%
Mortgage Type
Balloon
Estimated Equity
$542,793
Purchase Details
Closed on
Nov 28, 2001
Sold by
Reyes Luis G
Bought by
Cabrera Patrick M and Cabrera Rachelle S
Home Financials for this Owner
Home Financials are based on the most recent Mortgage that was taken out on this home.
Original Mortgage
$181,735
Interest Rate
6.39%
Mortgage Type
FHA
Purchase Details
Closed on
Jun 27, 1995
Sold by
Trzcinski Richard S
Bought by
Reyes Luis G and Reyes Suzanne M
Home Financials for this Owner
Home Financials are based on the most recent Mortgage that was taken out on this home.
Original Mortgage
$145,860
Interest Rate
7.63%
Mortgage Type
Assumption
Create a Home Valuation Report for This Property
The Home Valuation Report is an in-depth analysis detailing your home's value as well as a comparison with similar homes in the area
Home Values in the Area
Average Home Value in this Area
Purchase History
| Date | Buyer | Sale Price | Title Company |
|---|---|---|---|
| Guevara Ignacio F | $395,000 | First American Title Co | |
| Cabrera Patrick M | $185,000 | First American Title Ins Co | |
| Reyes Luis G | $146,000 | Commonwealth Land Title Co |
Source: Public Records
Mortgage History
| Date | Status | Borrower | Loan Amount |
|---|---|---|---|
| Open | Guevara Ignacio F | $316,000 | |
| Previous Owner | Cabrera Patrick M | $181,735 | |
| Previous Owner | Reyes Luis G | $145,860 |
Source: Public Records
Tax History Compared to Growth
Tax History
| Year | Tax Paid | Tax Assessment Tax Assessment Total Assessment is a certain percentage of the fair market value that is determined by local assessors to be the total taxable value of land and additions on the property. | Land | Improvement |
|---|---|---|---|---|
| 2025 | $5,846 | $539,804 | $188,932 | $350,872 |
| 2024 | $5,846 | $529,219 | $185,227 | $343,992 |
| 2023 | $5,683 | $518,842 | $181,595 | $337,247 |
| 2022 | $5,609 | $508,668 | $178,034 | $330,634 |
| 2021 | $5,369 | $480,000 | $168,000 | $312,000 |
| 2020 | $4,991 | $449,100 | $157,600 | $291,500 |
| 2019 | $4,901 | $436,000 | $153,000 | $283,000 |
| 2018 | $4,528 | $400,000 | $140,000 | $260,000 |
| 2017 | $4,223 | $379,000 | $133,000 | $246,000 |
| 2016 | $3,598 | $328,700 | $115,500 | $213,200 |
| 2015 | $3,458 | $313,000 | $110,000 | $203,000 |
| 2014 | $3,419 | $313,000 | $110,000 | $203,000 |
Source: Public Records
Map
Nearby Homes
- 2453 S Marigold Place
- 2413 S Parco Ave
- 2708 S Parkside Dr
- 2535 S Imperial Place
- 2424 S Lake Ave
- 2437 S Garfield Place
- 1020 E Tam o Shanter Ct
- 1456 E Philadelphia St Unit 134
- 1456 E Philadelphia St Unit 378
- 1456 E Philadelphia St
- 1456 E Philadelphia St Unit 279
- 1456 E Philadelphia St Unit 132
- 1456 E Philadelphia St Unit 39
- 1456 E Philadelphia St Unit 41
- 1456 E Philadelphia St Unit 311
- 1456 E Philadelphia St Unit 158
- 1456 E Philadelphia St Unit 109
- 1456 E Philadelphia St Unit 351
- 1456 E Philadelphia St Unit 154
- 2523 S Calaveras Place
- 2511 S Calaveras Place
- 2516 S Del Norte Ave
- 2510 S Del Norte Ave
- 2522 S Del Norte Ave
- 2529 S Calaveras Place
- 2504 S Del Norte Ave
- 2528 S Del Norte Ave
- 2516 S Calaveras Place
- 2522 S Calaveras Place
- 2535 S Calaveras Place
- 2444 S Calaveras Place
- 2528 S Calaveras Place
- 2534 S Del Norte Ave
- 1303 E Oak Hill Dr
- 1225 E Oak Hill Dr
- 2534 S Calaveras Place
- 2541 S Calaveras Place
- 2517 S Del Norte Ave
- 2438 S Calaveras Place