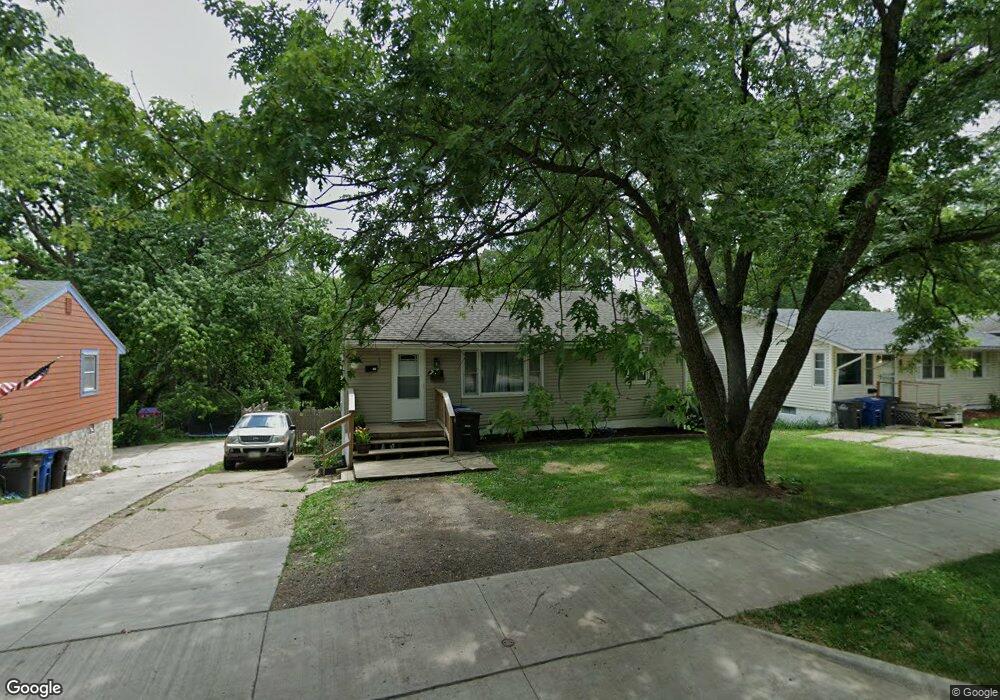
2517 South Union St Des Moines, IA 50315
Indianola Hills NeighborhoodEstimated Value: $191,000 - $240,000
3
Beds
3
Baths
936
Sq Ft
$226/Sq Ft
Est. Value
About This Home
This home is located at 2517 South Union St, Des Moines, IA 50315 and is currently estimated at $211,687, approximately $226 per square foot. 2517 South Union St is a home located in Polk County with nearby schools including Howe Elementary School, Weeks Middle School, and Lincoln High School.
Ownership History
Date
Name
Owned For
Owner Type
Purchase Details
Closed on
Feb 10, 2023
Sold by
Situmeang Carlin and Situmeang Josie
Bought by
Cruz Santiago German H
Current Estimated Value
Home Financials for this Owner
Home Financials are based on the most recent Mortgage that was taken out on this home.
Original Mortgage
$35,200
Outstanding Balance
$27,693
Interest Rate
5.76%
Estimated Equity
$183,994
Purchase Details
Closed on
May 10, 2019
Sold by
Zora Kennedy Tyler and Zora Zakir Kennedy
Bought by
Situmeang Carlin and Situmeang Josie
Home Financials for this Owner
Home Financials are based on the most recent Mortgage that was taken out on this home.
Original Mortgage
$134,000
Interest Rate
4%
Mortgage Type
New Conventional
Purchase Details
Closed on
Aug 16, 2018
Sold by
Us Bank Na
Bought by
Kennedy Tyler
Purchase Details
Closed on
Feb 13, 2018
Sold by
Estate Of Maxine L Kadner
Bought by
U S Bank National Association and Rmac Trust
Create a Home Valuation Report for This Property
The Home Valuation Report is an in-depth analysis detailing your home's value as well as a comparison with similar homes in the area
Home Values in the Area
Average Home Value in this Area
Purchase History
| Date | Buyer | Sale Price | Title Company |
|---|---|---|---|
| Cruz Santiago German H | $197,500 | -- | |
| Situmeang Carlin | $144,000 | None Available | |
| Kennedy Tyler | $61,000 | Mortgage Connect Lp | |
| U S Bank National Association | $97,246 | None Available |
Source: Public Records
Mortgage History
| Date | Status | Borrower | Loan Amount |
|---|---|---|---|
| Open | Cruz Santiago German H | $35,200 | |
| Open | Cruz Santiago German H | $158,000 | |
| Previous Owner | Situmeang Carlin | $134,000 |
Source: Public Records
Tax History Compared to Growth
Tax History
| Year | Tax Paid | Tax Assessment Tax Assessment Total Assessment is a certain percentage of the fair market value that is determined by local assessors to be the total taxable value of land and additions on the property. | Land | Improvement |
|---|---|---|---|---|
| 2025 | $3,426 | $187,500 | $24,800 | $162,700 |
| 2024 | $3,426 | $174,200 | $22,600 | $151,600 |
| 2023 | $3,236 | $174,200 | $22,600 | $151,600 |
| 2022 | $3,212 | $137,300 | $18,400 | $118,900 |
| 2021 | $3,010 | $137,300 | $18,400 | $118,900 |
| 2020 | $2,400 | $120,600 | $16,000 | $104,600 |
| 2019 | $2,280 | $92,600 | $16,000 | $76,600 |
| 2018 | $1,936 | $84,800 | $14,400 | $70,400 |
| 2017 | $1,913 | $84,800 | $14,400 | $70,400 |
| 2016 | $1,758 | $78,800 | $13,100 | $65,700 |
| 2015 | $1,758 | $78,800 | $13,100 | $65,700 |
| 2014 | $2,152 | $77,700 | $12,700 | $65,000 |
Source: Public Records
Map
Nearby Homes
- 106 E Creston Ave
- 80 Lacona Ave
- 303 Virginia Ave
- 220 Virginia Ave
- 2401 Courtland Dr
- 342 E Pleasant View Dr
- 2455 SW 7th St
- 323 E Broad St
- 350 E Creston Ave
- 301 Davis Ave
- 612 Creston Ave
- 307 Davis Ave
- 2234 Highland St
- 00 Kirkwood Ave
- 804 Lacona Ave
- 2603 Indianola Ave
- 119 E Park Ave
- 206 Fulton Dr
- 314 E Gray St
- 217 E Park Ave
- 2517 S Union St
- 2519 South Union St
- 2513 South Union St
- 2519 S Union St
- 2523 South Union St
- 2509 South Union St
- 2509 S Union St
- 2535 South Union St
- 2505 S Union St
- 2505 South Union St
- 101 Bell Ave
- 2500 South Union St
- 2601 South Union St
- 2510 South Union St
- 107 Bell Ave
- 2444 South Union St
- 2607 S Union St
- 3 E Bell Ave
- 9 E Bell Ave
- 2607 South Union St