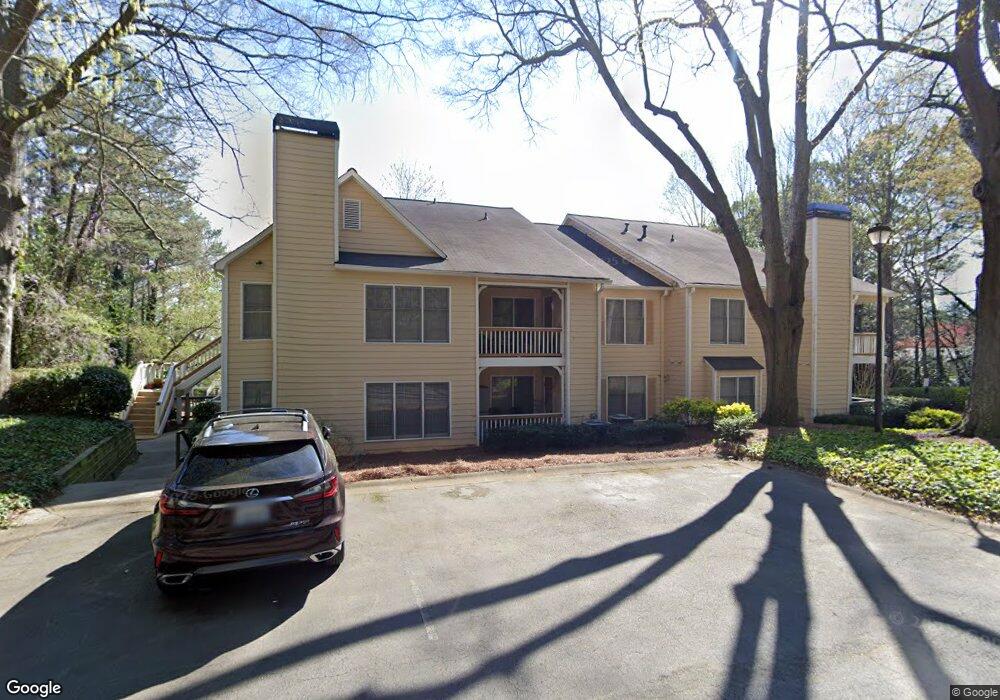
2517 Vineyard Way SE Smyrna, GA 30082
Estimated Value: $186,000 - $208,000
1
Bed
1
Bath
979
Sq Ft
$199/Sq Ft
Est. Value
About This Home
This home is located at 2517 Vineyard Way SE, Smyrna, GA 30082 and is currently estimated at $195,000, approximately $199 per square foot. 2517 Vineyard Way SE is a home located in Cobb County with nearby schools including Norton Park Elementary School, Griffin Middle School, and Campbell High School.
Ownership History
Date
Name
Owned For
Owner Type
Purchase Details
Closed on
Apr 8, 2021
Sold by
Stiles Casey P
Bought by
Freedom Streams Llc
Current Estimated Value
Purchase Details
Closed on
May 15, 2020
Sold by
Hysa Myriam and Hysa Genci
Bought by
Stiles Casey P
Purchase Details
Closed on
Feb 14, 2003
Sold by
Solomon Cornelius G J R
Bought by
Hysa Genci and Hysa Myriam
Home Financials for this Owner
Home Financials are based on the most recent Mortgage that was taken out on this home.
Original Mortgage
$62,000
Interest Rate
5.89%
Mortgage Type
New Conventional
Purchase Details
Closed on
Jul 29, 2002
Sold by
Ray Verlene M
Bought by
Solomon Cornelius G
Purchase Details
Closed on
Sep 8, 1999
Sold by
Amspacher Terry
Bought by
Ray Verlene M
Home Financials for this Owner
Home Financials are based on the most recent Mortgage that was taken out on this home.
Original Mortgage
$47,150
Interest Rate
7.8%
Mortgage Type
New Conventional
Create a Home Valuation Report for This Property
The Home Valuation Report is an in-depth analysis detailing your home's value as well as a comparison with similar homes in the area
Home Values in the Area
Average Home Value in this Area
Purchase History
| Date | Buyer | Sale Price | Title Company |
|---|---|---|---|
| Freedom Streams Llc | -- | None Available | |
| Stiles Casey P | $82,500 | None Available | |
| Hysa Genci | $77,500 | -- | |
| Solomon Cornelius G | -- | -- | |
| Ray Verlene M | $55,500 | -- |
Source: Public Records
Mortgage History
| Date | Status | Borrower | Loan Amount |
|---|---|---|---|
| Previous Owner | Hysa Genci | $62,000 | |
| Previous Owner | Ray Verlene M | $47,150 |
Source: Public Records
Tax History Compared to Growth
Tax History
| Year | Tax Paid | Tax Assessment Tax Assessment Total Assessment is a certain percentage of the fair market value that is determined by local assessors to be the total taxable value of land and additions on the property. | Land | Improvement |
|---|---|---|---|---|
| 2025 | $2,317 | $76,896 | $20,000 | $56,896 |
| 2024 | $1,971 | $65,364 | $20,000 | $45,364 |
| 2023 | $1,790 | $59,364 | $14,000 | $45,364 |
| 2022 | $1,875 | $61,788 | $7,200 | $54,588 |
| 2021 | $1,002 | $33,000 | $6,000 | $27,000 |
| 2020 | $1,199 | $39,508 | $7,200 | $32,308 |
| 2019 | $1,053 | $34,704 | $7,200 | $27,504 |
| 2018 | $940 | $30,964 | $5,600 | $25,364 |
| 2017 | $622 | $21,640 | $4,000 | $17,640 |
| 2016 | $554 | $19,276 | $4,000 | $15,276 |
| 2015 | $451 | $15,296 | $4,000 | $11,296 |
| 2014 | $454 | $15,296 | $0 | $0 |
Source: Public Records
Map
Nearby Homes
- 2041 White Cypress Ct
- 119 Still Pine Bend
- 85 Smyrna Powder Springs Rd SE
- 2654 Estelle Ct SE
- 285 Windy Hill Rd SE
- 235 Still Pine Bend
- 355 Benson Manor Cir SE
- 51 Overbrook Dr SE Unit 3
- 33 Smyrna Powder Springs Rd SE
- 436 Floyd St SE
- 2831 Ivanhoe Ln SE
- 2771 Sherwood Rd SE
- 259 Diane Dr SE
- 260 Diane Dr SE
- 2618 Birch St SE
- 2379 Olive Springs Rd SE
- 2880 Sherwood Rd SE
- 2501 Vineyard Way SE Unit 2501
- 2509 Vineyard Way SE
- 2507 Vineyard Way SE
- 2501 Vineyard Way SE
- 2519 Vineyard Way SE
- 2515 Vineyard Way SE Unit 2515
- 2501 Vineyard Way SE
- 2513 Vineyard Way SE
- 2603 Vineyard Way SE Unit 2603
- 2611 Vineyard Way SE
- 2613 Vineyard Way SE
- 2615 Vineyard Way SE
- 2511 Vineyard Way SE
- 2505 Vineyard Way SE
- 2503 Vineyard Way SE
- 2619 Vineyard Way SE
- 2617 Vineyard Way SE
- 2609 Vineyard Way SE
- 2607 Vineyard Way SE
- 0 Vineyard Wa Unit 7099230