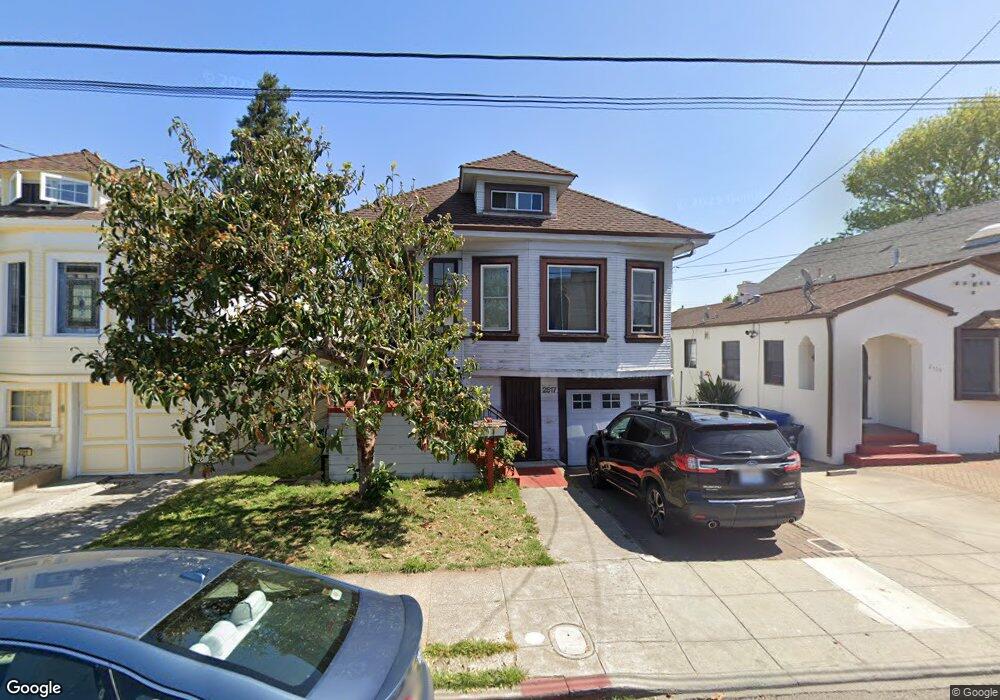
2517 Webb Ave Alameda, CA 94501
Downtown Alameda NeighborhoodEstimated Value: $1,138,000 - $1,553,673
3
Beds
3
Baths
2,053
Sq Ft
$626/Sq Ft
Est. Value
About This Home
This home is located at 2517 Webb Ave, Alameda, CA 94501 and is currently estimated at $1,286,168, approximately $626 per square foot. 2517 Webb Ave is a home located in Alameda County with nearby schools including Edison Elementary School, Lincoln Middle School, and Alameda High School.
Ownership History
Date
Name
Owned For
Owner Type
Purchase Details
Closed on
Nov 13, 2021
Sold by
Zhou Shaohang and Yu Qing Yun
Bought by
Zhou Shaohang and Yu Qing Yun
Current Estimated Value
Purchase Details
Closed on
Jan 5, 2018
Sold by
Hughes Alicia and The Nick Ramirez Santos Jr And
Bought by
Zhou Shaohang and Yu Qingyun
Purchase Details
Closed on
Feb 14, 2008
Sold by
Santos Nick R and Santos Isabel T
Bought by
Torio Santos Jr Nick Ramirez and Torio Santos Isabel
Purchase Details
Closed on
Feb 28, 2007
Sold by
Santos Nick R and Santos Isabel T
Bought by
Santos Nick R and Santos Isabel T
Home Financials for this Owner
Home Financials are based on the most recent Mortgage that was taken out on this home.
Original Mortgage
$195,000
Interest Rate
6.23%
Mortgage Type
New Conventional
Create a Home Valuation Report for This Property
The Home Valuation Report is an in-depth analysis detailing your home's value as well as a comparison with similar homes in the area
Home Values in the Area
Average Home Value in this Area
Purchase History
| Date | Buyer | Sale Price | Title Company |
|---|---|---|---|
| Zhou Shaohang | -- | None Available | |
| Zhou Shaohang | $950,000 | Chicago Title Company | |
| Torio Santos Jr Nick Ramirez | -- | None Available | |
| Santos Nick R | -- | United Capital Title Ins Co |
Source: Public Records
Mortgage History
| Date | Status | Borrower | Loan Amount |
|---|---|---|---|
| Previous Owner | Santos Nick R | $195,000 |
Source: Public Records
Tax History
| Year | Tax Paid | Tax Assessment Tax Assessment Total Assessment is a certain percentage of the fair market value that is determined by local assessors to be the total taxable value of land and additions on the property. | Land | Improvement |
|---|---|---|---|---|
| 2025 | $15,589 | $1,080,919 | $453,986 | $626,933 |
| 2024 | $15,589 | $1,059,724 | $445,084 | $614,640 |
| 2023 | $14,989 | $1,038,948 | $436,358 | $602,590 |
| 2022 | $14,652 | $1,018,579 | $427,803 | $590,776 |
| 2021 | $14,287 | $998,610 | $419,416 | $579,194 |
| 2020 | $14,110 | $988,379 | $415,119 | $573,260 |
| 2019 | $13,437 | $969,000 | $406,980 | $562,020 |
| 2018 | $2,664 | $58,449 | $30,165 | $28,284 |
| 2017 | $2,196 | $57,304 | $29,574 | $27,730 |
| 2016 | $2,163 | $56,180 | $28,994 | $27,186 |
| 2015 | $2,142 | $55,336 | $28,558 | $26,778 |
| 2014 | $1,904 | $54,252 | $27,999 | $26,253 |
Source: Public Records
Map
Nearby Homes
- 2608 Central Ave
- 1376 Versailles Ave
- 1817 Everett St
- 1321 Pearl St
- 2417 Marti Rae Ct
- 2811 Yosemite Ave
- 1324 Grove St
- 2312 San Antonio Ave
- 1848 Walnut St
- 2853 Regatta Dr Unit 179
- 2875 Glascock St Unit 209
- 3024 Fernside Blvd
- 976 Park St
- 3090 Glascock St Unit 405
- 954 Park St
- 1718 High St
- 1036 Regent St
- 3235 Central Ave
- 2056 Santa Clara Ave
- 3246 Garfield Ave
- 2519 Webb Ave
- 2511 Webb Ave
- 2521 Webb Ave
- 2509 Webb Ave
- 2523 Webb Ave
- 2516 Lincoln Ave
- 2525 Webb Ave
- 2512 Lincoln Ave
- 2518 Lincoln Ave
- 1550 Everett St
- 2510 Lincoln Ave
- 1526 Everett St Unit 4
- 1526 Everett St
- 2522 Lincoln Ave
- 1552 Everett St
- 2529 Webb Ave
- 2524 Lincoln Ave
- 1554 Everett St
- 1514 Everett St
- 2528 Lincoln Ave
Your Personal Tour Guide
Ask me questions while you tour the home.