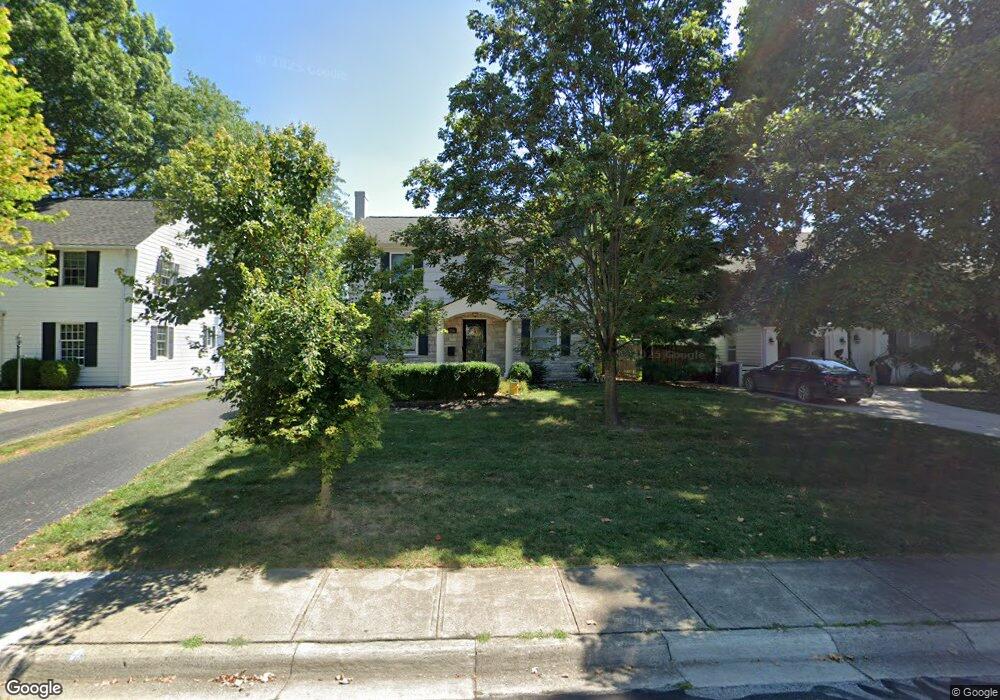
2518 Brandon Rd Columbus, OH 43221
Estimated Value: $544,853 - $588,000
3
Beds
2
Baths
1,616
Sq Ft
$353/Sq Ft
Est. Value
About This Home
This home is located at 2518 Brandon Rd, Columbus, OH 43221 and is currently estimated at $570,463, approximately $353 per square foot. 2518 Brandon Rd is a home located in Franklin County with nearby schools including Tremont Elementary School, Jones Middle School, and Upper Arlington High School.
Ownership History
Date
Name
Owned For
Owner Type
Purchase Details
Closed on
Jul 6, 2023
Sold by
Zelch Michael J
Bought by
B And K Properties Llc
Current Estimated Value
Purchase Details
Closed on
Sep 28, 2001
Sold by
Hink John F and Hink Julianna E
Bought by
Hanf Robert W and Dutney Kathleen A
Purchase Details
Closed on
Feb 3, 1999
Sold by
Knopp Yuka M
Bought by
Hink John F and Hink Julianna E
Home Financials for this Owner
Home Financials are based on the most recent Mortgage that was taken out on this home.
Original Mortgage
$139,900
Interest Rate
6.94%
Purchase Details
Closed on
Nov 23, 1992
Create a Home Valuation Report for This Property
The Home Valuation Report is an in-depth analysis detailing your home's value as well as a comparison with similar homes in the area
Home Values in the Area
Average Home Value in this Area
Purchase History
| Date | Buyer | Sale Price | Title Company |
|---|---|---|---|
| B And K Properties Llc | -- | None Listed On Document | |
| Hanf Robert W | $236,300 | -- | |
| Hink John F | $169,900 | Chicago Title | |
| -- | $127,000 | -- |
Source: Public Records
Mortgage History
| Date | Status | Borrower | Loan Amount |
|---|---|---|---|
| Previous Owner | Hink John F | $139,900 |
Source: Public Records
Tax History Compared to Growth
Tax History
| Year | Tax Paid | Tax Assessment Tax Assessment Total Assessment is a certain percentage of the fair market value that is determined by local assessors to be the total taxable value of land and additions on the property. | Land | Improvement |
|---|---|---|---|---|
| 2024 | $9,074 | $153,760 | $66,890 | $86,870 |
| 2023 | $8,267 | $153,760 | $66,890 | $86,870 |
| 2022 | $7,572 | $117,110 | $42,420 | $74,690 |
| 2021 | $6,703 | $117,110 | $42,420 | $74,690 |
| 2020 | $6,643 | $117,110 | $42,420 | $74,690 |
| 2019 | $6,294 | $99,510 | $42,420 | $57,090 |
| 2018 | $6,015 | $99,510 | $42,420 | $57,090 |
| 2017 | $6,011 | $99,510 | $42,420 | $57,090 |
| 2016 | $5,776 | $96,110 | $40,670 | $55,440 |
| 2015 | $5,771 | $96,110 | $40,670 | $55,440 |
| 2014 | $5,778 | $96,110 | $40,670 | $55,440 |
| 2013 | $2,731 | $87,360 | $36,960 | $50,400 |
Source: Public Records
Map
Nearby Homes
- 2569 Chester Rd
- 2585 Westmont Blvd
- 2615 Northwest Blvd
- 2648 Chester Rd
- 1550 College Hill Dr
- 2276 Northwest Blvd
- 1565 Berkshire Rd
- 1932 Suffolk Rd Unit 1932
- 1535 Doone Rd
- 1470 Cardiff Rd
- 2063 Westover Rd
- 2593 Coventry Rd
- 1481 Doone Rd
- 1488 Essex Rd
- 2110 Northwest Blvd
- 2027-2033 Ridgeview Rd
- 1909 Inchcliff Rd
- 3015 Welsford Rd
- 1934 Bedford Rd
- 1887-1891 Kentwell Rd
- 2526 Brandon Rd
- 2510 Brandon Rd
- 2534 Brandon Rd
- 2502 Brandon Rd
- 2513 Chester Rd
- 2521 Chester Rd
- 2505 Chester Rd
- 2519 Brandon Rd
- 2529 Chester Rd
- 2542 Brandon Rd
- 2511 Brandon Rd
- 2495 Chester Rd
- 2527 Brandon Rd
- 2535 Brandon Rd
- 2503 Brandon Rd
- 2537 Chester Rd
- 2550 Brandon Rd
- 2543 Brandon Rd
- 2545 Chester Rd
- 2551 Brandon Rd