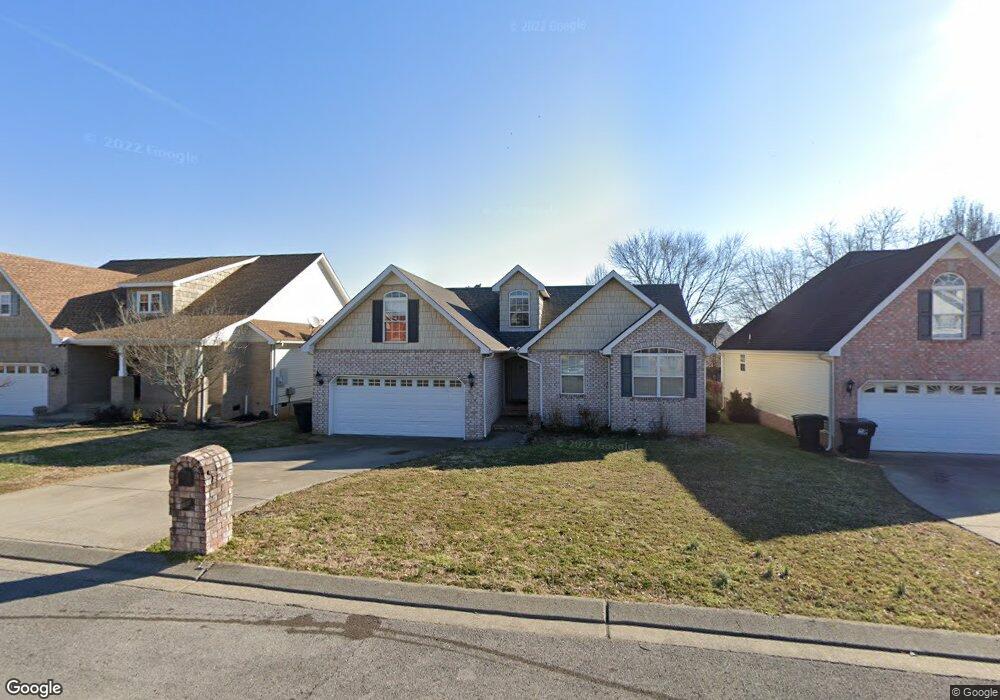
2518 Claymore Run Murfreesboro, TN 37130
Estimated Value: $377,811 - $414,000
--
Bed
2
Baths
1,625
Sq Ft
$242/Sq Ft
Est. Value
About This Home
This home is located at 2518 Claymore Run, Murfreesboro, TN 37130 and is currently estimated at $393,703, approximately $242 per square foot. 2518 Claymore Run is a home located in Rutherford County with nearby schools including John Pittard Elementary School, Oakland Middle School, and Oakland High School.
Ownership History
Date
Name
Owned For
Owner Type
Purchase Details
Closed on
Oct 20, 2021
Sold by
Starr Sara
Bought by
Starr Alexander James
Current Estimated Value
Home Financials for this Owner
Home Financials are based on the most recent Mortgage that was taken out on this home.
Original Mortgage
$266,400
Outstanding Balance
$243,803
Interest Rate
3.05%
Estimated Equity
$149,900
Purchase Details
Closed on
Jul 24, 2012
Sold by
Barnes Sarah Beth
Bought by
Starr Alexander James Sar
Purchase Details
Closed on
Jul 19, 2007
Sold by
Youngquist Charles D
Bought by
Beth Barnes Sarah
Purchase Details
Closed on
May 31, 2005
Sold by
Hunt Kyle P
Bought by
Thansamai Somphone D and Thansamai Vilavan
Purchase Details
Closed on
Sep 3, 2004
Sold by
Gmas Global Relocation Ser
Bought by
Youngquist Charles D and Youngquist Kayla A
Create a Home Valuation Report for This Property
The Home Valuation Report is an in-depth analysis detailing your home's value as well as a comparison with similar homes in the area
Home Values in the Area
Average Home Value in this Area
Purchase History
| Date | Buyer | Sale Price | Title Company |
|---|---|---|---|
| Starr Alexander James | -- | None Available | |
| Starr Alexander James Sar | $144,000 | -- | |
| Beth Barnes Sarah | $157,000 | -- | |
| Thansamai Somphone D | $194,900 | -- | |
| Youngquist Charles D | $149,000 | -- | |
| Gmac Global Relocation Service | $149,000 | -- |
Source: Public Records
Mortgage History
| Date | Status | Borrower | Loan Amount |
|---|---|---|---|
| Open | Starr Alexander James | $266,400 |
Source: Public Records
Tax History Compared to Growth
Tax History
| Year | Tax Paid | Tax Assessment Tax Assessment Total Assessment is a certain percentage of the fair market value that is determined by local assessors to be the total taxable value of land and additions on the property. | Land | Improvement |
|---|---|---|---|---|
| 2025 | $2,061 | $72,875 | $13,750 | $59,125 |
| 2024 | $2,061 | $72,875 | $13,750 | $59,125 |
| 2023 | $1,369 | $72,950 | $13,750 | $59,200 |
| 2022 | $1,179 | $72,950 | $13,750 | $59,200 |
| 2021 | $1,119 | $50,425 | $9,125 | $41,300 |
| 2020 | $1,119 | $50,425 | $9,125 | $41,300 |
| 2019 | $1,119 | $50,425 | $9,125 | $41,300 |
| 2018 | $1,538 | $50,425 | $0 | $0 |
| 2017 | $1,367 | $35,175 | $0 | $0 |
| 2016 | $1,367 | $35,175 | $0 | $0 |
| 2015 | $1,367 | $35,175 | $0 | $0 |
| 2014 | $875 | $35,175 | $0 | $0 |
| 2013 | -- | $37,550 | $0 | $0 |
Source: Public Records
Map
Nearby Homes
- 2164 White Poplar Ct
- 2110 Stillwell Ct
- 2111 Lovelace Ln
- 2223 Brick Way
- 2427 Donald Bradley Ct
- 1430 Avellino Cir
- 1512 Mirabella Way
- 0 Pitts Ln
- 1409 E Northfield Blvd
- 2303 Lionheart Dr
- 2403 English Hill Dr
- 1640 Drayton Dr
- 1935 Robinson Rd
- 2331 Lionheart Dr
- 1913 Baskinbrook Ct
- 2510 Mission Ridge Dr
- 1325 E Northfield Blvd
- 1437 Orange Ct
- 2553 Jackalope St
- 1728 Shagbark Trail
- 2522 Claymore Run
- 2514 Claymore Run
- 2525 Kilkenny Ct
- 2510 Claymore Run
- 2526 Claymore Run
- 2529 Kilkenny Ct
- 2521 Kilkenny Ct
- 2530 Claymore Run
- 2386 Oak Hill Dr
- 2390 Oak Hill Dr
- 2517 Kilkenny Ct
- 2511 Claymore Run
- 2382 Oak Hill Dr
- 2533 Kilkenny Ct
- 2378 Oak Hill Dr
- 2535 Claymore Run
- 2534 Claymore Run
- 2519 Claymore Run
- 2464 Oak Hill Dr
- 2374 Oak Hill Dr