Estimated Value: $1,294,246
Studio
--
Bath
3,200
Sq Ft
$404/Sq Ft
Est. Value
About This Home
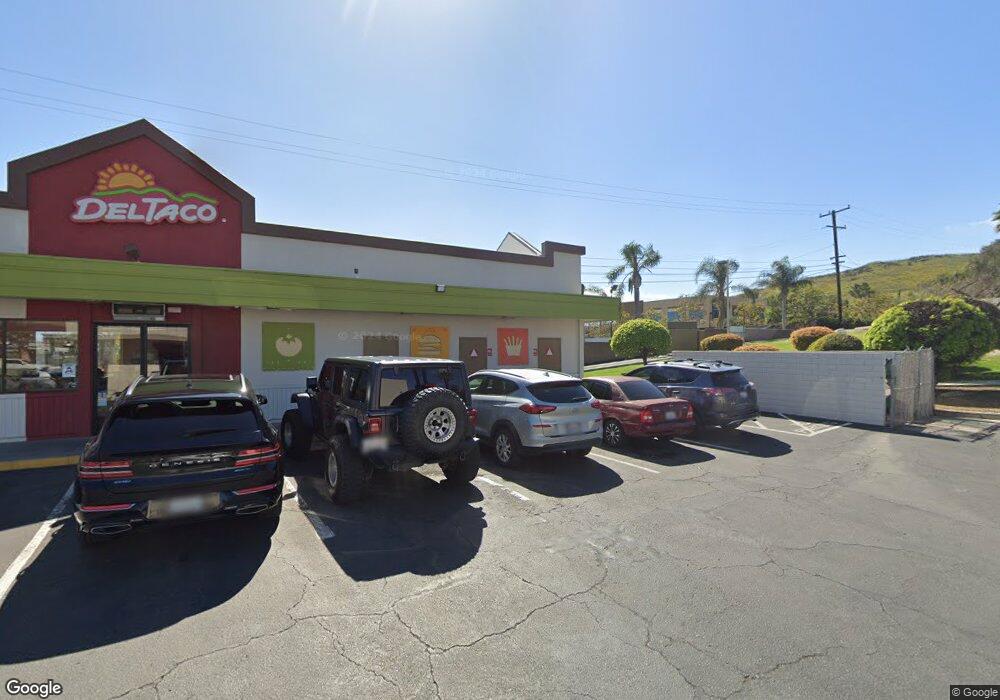
This home is located at 2518 Hamner Ave, Norco, CA 92860 and is currently estimated at $1,294,246, approximately $404 per square foot. 2518 Hamner Ave is a home located in Riverside County with nearby schools including Highland Elementary, Norco Intermediate School, and Norco High School.
Ownership History
Date
Name
Owned For
Owner Type
Purchase Details
Closed on
Jun 28, 2016
Sold by
Salman Ali and Mollamohseni Hengameh
Bought by
The Salman Mollamohseni Family Trust
Current Estimated Value
Purchase Details
Closed on
Sep 24, 2013
Sold by
Salman Ali
Bought by
Mollamohseni Hengameh and Salman Ali
Purchase Details
Closed on
May 8, 2012
Sold by
Coleman Robert and Coleman Mary Eloise
Bought by
Salman Ali
Home Financials for this Owner
Home Financials are based on the most recent Mortgage that was taken out on this home.
Original Mortgage
$752,000
Outstanding Balance
$521,999
Interest Rate
3.94%
Mortgage Type
Commercial
Estimated Equity
$772,247
Purchase Details
Closed on
May 1, 2012
Sold by
Mollamohseni Hengameh
Bought by
Salman Ali
Home Financials for this Owner
Home Financials are based on the most recent Mortgage that was taken out on this home.
Original Mortgage
$752,000
Outstanding Balance
$521,999
Interest Rate
3.94%
Mortgage Type
Commercial
Estimated Equity
$772,247
Purchase Details
Closed on
Nov 18, 2008
Sold by
Woodcock Gerald C
Bought by
Coleman Robert and Coleman Mary Eloise
Purchase Details
Closed on
Sep 28, 2006
Sold by
Woodcock Patricia M
Bought by
Woodcock Gary C
Home Financials for this Owner
Home Financials are based on the most recent Mortgage that was taken out on this home.
Original Mortgage
$138,172
Interest Rate
6.37%
Mortgage Type
Commercial
Purchase Details
Closed on
Jan 10, 2002
Sold by
Woodcock Gerald C and Woodcock Patricia
Bought by
Woodcock Gerald C and Woodcock Patricia
Purchase Details
Closed on
Aug 15, 2001
Sold by
Woodcock Gerald C and Woodcock Patricia
Bought by
Woodcock Gerald C and Woodcock Patricia
Purchase Details
Closed on
Apr 12, 2001
Sold by
Simms Mary Louise
Bought by
Woodcock Gary and Woodcock Patricia
Home Financials for this Owner
Home Financials are based on the most recent Mortgage that was taken out on this home.
Original Mortgage
$160,000
Interest Rate
7.19%
Mortgage Type
Commercial
Purchase Details
Closed on
Nov 12, 2000
Sold by
Apex Investments Llc
Bought by
Simms Mary Louise
Purchase Details
Closed on
Nov 8, 1999
Sold by
U S Small Business Administration
Bought by
Apex Investments Llc
Purchase Details
Closed on
Oct 2, 1998
Sold by
Dana Niguel Bank Na
Bought by
U S Small Business Admin
Purchase Details
Closed on
Aug 7, 1998
Sold by
First Impression Early Education Center
Bought by
Dana Niguel Bank Na
Create a Home Valuation Report for This Property
The Home Valuation Report is an in-depth analysis detailing your home's value as well as a comparison with similar homes in the area
Home Values in the Area
Average Home Value in this Area
Purchase History
| Date | Buyer | Sale Price | Title Company |
|---|---|---|---|
| The Salman Mollamohseni Family Trust | -- | None Available | |
| Mollamohseni Hengameh | -- | None Available | |
| Salman Ali | -- | North American Title Co Inc | |
| Salman Ali | -- | North American Title Co Inc | |
| Coleman Robert | -- | None Available | |
| Woodcock Gary C | -- | Orange Coast Title Co | |
| Woodcock Gerald C | -- | Orange Coast Title Co | |
| Woodcock Gerald C | -- | -- | |
| Woodcock Gerald C | -- | Orange Coast Title | |
| Woodcock Gary | $400,000 | Orange Coast Title | |
| Simms Mary Louise | -- | -- | |
| Apex Investments Llc | $250,000 | Chicago Title Co | |
| U S Small Business Admin | -- | Chicago Title Co | |
| Dana Niguel Bank Na | $292,300 | Benefit Land Title Ins Co |
Source: Public Records
Mortgage History
| Date | Status | Borrower | Loan Amount |
|---|---|---|---|
| Open | Salman Ali | $752,000 | |
| Previous Owner | Woodcock Gerald C | $138,172 | |
| Previous Owner | Woodcock Gary | $160,000 | |
| Closed | Woodcock Gary | $160,000 |
Source: Public Records
Tax History
| Year | Tax Paid | Tax Assessment Tax Assessment Total Assessment is a certain percentage of the fair market value that is determined by local assessors to be the total taxable value of land and additions on the property. | Land | Improvement |
|---|---|---|---|---|
| 2025 | $12,250 | $1,111,595 | $747,348 | $364,247 |
| 2023 | $12,250 | $1,068,432 | $718,329 | $350,103 |
| 2022 | $11,865 | $1,047,484 | $704,245 | $343,239 |
| 2021 | $11,634 | $1,026,946 | $690,437 | $336,509 |
| 2020 | $11,506 | $1,016,417 | $683,358 | $333,059 |
| 2019 | $11,242 | $996,488 | $669,959 | $326,529 |
| 2018 | $10,977 | $976,950 | $656,821 | $320,129 |
| 2017 | $10,695 | $957,795 | $643,943 | $313,852 |
| 2016 | $10,575 | $939,016 | $631,317 | $307,699 |
| 2015 | $10,344 | $924,913 | $621,835 | $303,078 |
| 2014 | $9,962 | $906,797 | $609,655 | $297,142 |
Source: Public Records
Map
Nearby Homes
- 2655 Hamner Ave
- 1642 4th St
- 1951 Valley View Ave
- 2365 Chatterton Ln
- 2353 Corona Ave
- 2320 Temescal Ave
- 3149 Sierra Ave
- 2160 Temescal Ave
- 0 6th & Valleyview St Unit SW25164144
- 1820 Corona Ave
- 2036 Temescal Ave
- 2821 Riding Ring Rd
- 1454 Hilltop Ln
- 1436 Hilltop Ln
- 1621 Valley View Ave
- 989 3rd St
- 3480 Hamner Ave
- 2904 2nd St
- 1775 Acre St
- 1500 Corona Ave
- 2488 Hamner Ave
- 1860 Lampton Ln
- 2503 Hamner Ave
- 2475 Hamner Ave
- 1725 Lampton Ln
- 2471 Hamner Ave
- 1741 3rd St Unit B
- 1741 3rd St
- 1741 3rd St Unit D
- 1819 Lampton Ln
- 2481 Hamner Ave
- 2650 Hamner Ave
- 2429 Hamner Ave
- 2660 Clark Ave
- 1801 3rd St
- 2665 Clark Ave
- 2641 Hamner Ave
- 2666 Hamner Ave
- 1647 3rd St
- 2680 Clark Ave
Your Personal Tour Guide
Ask me questions while you tour the home.