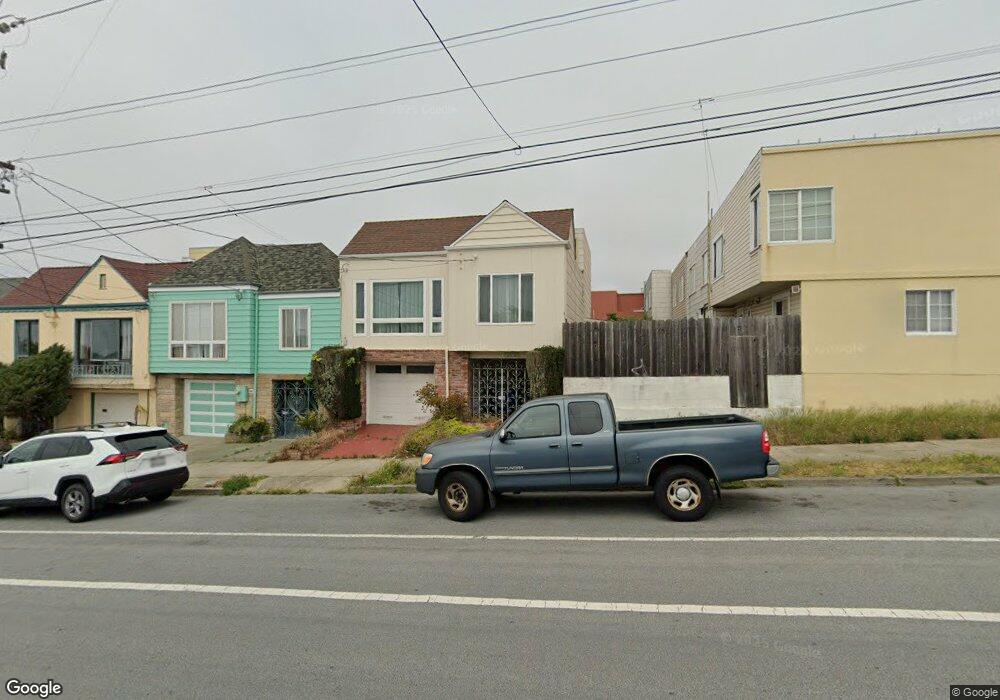
2518 Ortega St San Francisco, CA 94122
Central Sunset NeighborhoodEstimated Value: $1,667,000 - $1,992,957
4
Beds
2
Baths
1,750
Sq Ft
$1,032/Sq Ft
Est. Value
About This Home
This home is located at 2518 Ortega St, San Francisco, CA 94122 and is currently estimated at $1,805,739, approximately $1,031 per square foot. 2518 Ortega St is a home located in San Francisco County with nearby schools including Stevenson (Robert Louis) Elementary School, Giannini (A.P.) Middle School, and Cornerstone Academy-Lawton Campus.
Ownership History
Date
Name
Owned For
Owner Type
Purchase Details
Closed on
Oct 11, 2016
Sold by
Fazio William
Bought by
Tin Yung and Ni Wei
Current Estimated Value
Home Financials for this Owner
Home Financials are based on the most recent Mortgage that was taken out on this home.
Original Mortgage
$500,000
Outstanding Balance
$425,898
Interest Rate
5.62%
Mortgage Type
Adjustable Rate Mortgage/ARM
Estimated Equity
$1,379,841
Purchase Details
Closed on
Aug 24, 2005
Sold by
Fazio Ann
Bought by
Fazio Ann
Create a Home Valuation Report for This Property
The Home Valuation Report is an in-depth analysis detailing your home's value as well as a comparison with similar homes in the area
Home Values in the Area
Average Home Value in this Area
Purchase History
| Date | Buyer | Sale Price | Title Company |
|---|---|---|---|
| Tin Yung | $1,050,000 | Chicago Title Company | |
| Fazio Ann | -- | None Available |
Source: Public Records
Mortgage History
| Date | Status | Borrower | Loan Amount |
|---|---|---|---|
| Open | Tin Yung | $500,000 |
Source: Public Records
Tax History Compared to Growth
Tax History
| Year | Tax Paid | Tax Assessment Tax Assessment Total Assessment is a certain percentage of the fair market value that is determined by local assessors to be the total taxable value of land and additions on the property. | Land | Improvement |
|---|---|---|---|---|
| 2025 | $16,875 | $1,407,782 | $853,028 | $554,754 |
| 2024 | $16,875 | $1,380,179 | $836,302 | $543,877 |
| 2023 | $16,619 | $1,353,118 | $819,904 | $533,214 |
| 2022 | $16,300 | $1,326,588 | $803,828 | $522,760 |
| 2021 | $16,010 | $1,300,578 | $788,067 | $512,511 |
| 2020 | $16,133 | $1,287,243 | $779,987 | $507,256 |
| 2019 | $15,531 | $1,262,005 | $764,694 | $497,311 |
| 2018 | $15,006 | $1,237,260 | $749,700 | $487,560 |
| 2017 | $12,701 | $1,050,000 | $735,000 | $315,000 |
| 2016 | $1,383 | $94,411 | $28,078 | $66,333 |
| 2015 | $1,096 | $92,994 | $27,657 | $65,337 |
| 2014 | $1,067 | $91,174 | $27,116 | $64,058 |
Source: Public Records
Map
Nearby Homes