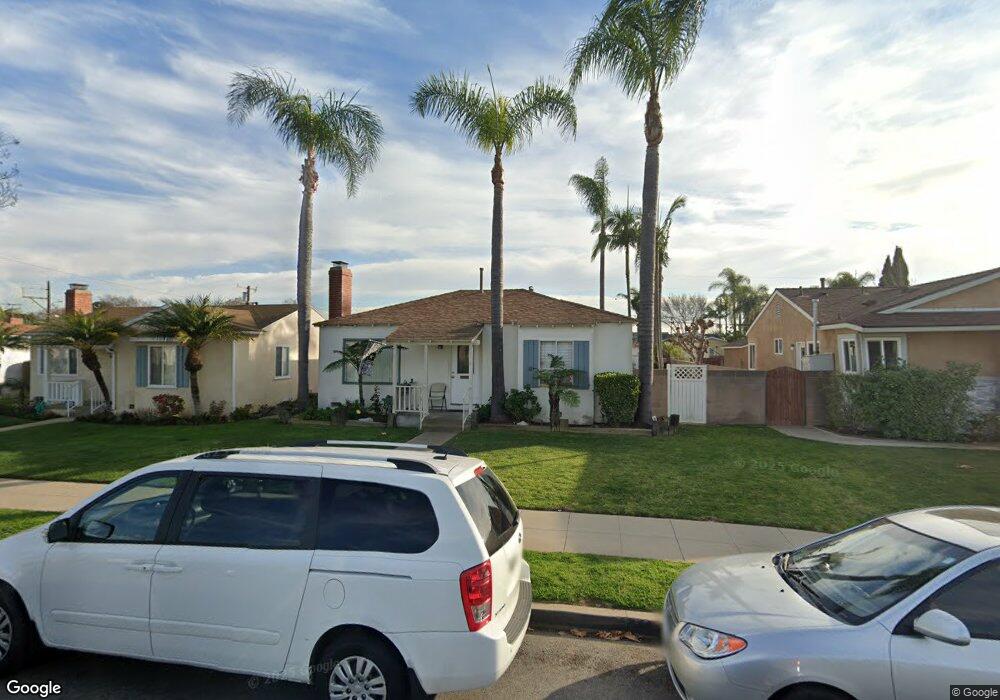
2518 W 156th St Gardena, CA 90249
Estimated Value: $872,000 - $1,053,000
3
Beds
2
Baths
1,479
Sq Ft
$634/Sq Ft
Est. Value
About This Home
This home is located at 2518 W 156th St, Gardena, CA 90249 and is currently estimated at $938,062, approximately $634 per square foot. 2518 W 156th St is a home located in Los Angeles County with nearby schools including One Hundred Fifty-Sixth Street Elementary School, Robert E. Peary Middle School, and Gardena Senior High School.
Ownership History
Date
Name
Owned For
Owner Type
Purchase Details
Closed on
Oct 24, 2006
Sold by
Heine Catherine A
Bought by
Noel Gregory S and Gregory S Noel Trust
Current Estimated Value
Home Financials for this Owner
Home Financials are based on the most recent Mortgage that was taken out on this home.
Original Mortgage
$409,800
Outstanding Balance
$255,036
Interest Rate
7.25%
Mortgage Type
Purchase Money Mortgage
Estimated Equity
$683,026
Purchase Details
Closed on
May 5, 2000
Sold by
Foster June O Tr June O Foster Trust
Bought by
Heine Catherine A
Home Financials for this Owner
Home Financials are based on the most recent Mortgage that was taken out on this home.
Original Mortgage
$182,400
Interest Rate
8.22%
Purchase Details
Closed on
Aug 29, 1995
Sold by
Foster June O
Bought by
Foster June O and The June O Foster Living Trust
Create a Home Valuation Report for This Property
The Home Valuation Report is an in-depth analysis detailing your home's value as well as a comparison with similar homes in the area
Home Values in the Area
Average Home Value in this Area
Purchase History
| Date | Buyer | Sale Price | Title Company |
|---|---|---|---|
| Noel Gregory S | $546,500 | Progressive Title | |
| Heine Catherine A | $228,000 | Lawyers Title Company | |
| Foster June O | -- | -- |
Source: Public Records
Mortgage History
| Date | Status | Borrower | Loan Amount |
|---|---|---|---|
| Open | Noel Gregory S | $409,800 | |
| Previous Owner | Heine Catherine A | $182,400 |
Source: Public Records
Tax History Compared to Growth
Tax History
| Year | Tax Paid | Tax Assessment Tax Assessment Total Assessment is a certain percentage of the fair market value that is determined by local assessors to be the total taxable value of land and additions on the property. | Land | Improvement |
|---|---|---|---|---|
| 2025 | $8,897 | $732,173 | $585,745 | $146,428 |
| 2024 | $8,897 | $717,817 | $574,260 | $143,557 |
| 2023 | $8,737 | $703,743 | $563,000 | $140,743 |
| 2022 | $8,298 | $689,945 | $551,961 | $137,984 |
| 2021 | $8,212 | $676,418 | $541,139 | $135,279 |
| 2019 | $7,685 | $634,000 | $507,000 | $127,000 |
| 2018 | $7,059 | $575,000 | $460,000 | $115,000 |
| 2016 | $5,548 | $450,000 | $360,300 | $89,700 |
| 2015 | $5,536 | $450,000 | $360,300 | $89,700 |
| 2014 | $5,640 | $450,000 | $360,300 | $89,700 |
Source: Public Records
Map
Nearby Homes
- 2612 Manhattan Beach Blvd
- 15423 Van Ness Ave
- 15839 Apollo Place
- 15331 Jasmine Ln Unit 105
- 2501 W Redondo Beach Blvd Unit 317
- 2501 W Redondo Beach Blvd Unit 306
- 16028 Arcturus Ave
- 15200 Atkinson Ave
- 2040 W 154th St
- 2072 Redondo Beach Blvd
- 2116 Marine Ave
- 2015 W 157th St
- 2605 W 163rd St
- 1935 W 154th Place
- 3129 Marine Ave Unit 7
- 15524 Ruthelen St
- 15522 Faysmith Ave
- 14835 Wadkins Ave
- 14815 Crenshaw Blvd
- 14751 Wadkins Ave
- 2522 W 156th St
- 2512 W 156th St
- 2526 W 156th St
- 2508 W 156th St
- 2530 W 156th St
- 2517 W 157th St
- 2504 W 156th St
- 2513 W 157th St
- 2523 W 157th St
- 2507 W 157th St
- 2529 W 157th St
- 2519 W 156th St
- 2515 W 156th St
- 2523 W 156th St
- 2509 W 156th St
- 2501 W 157th St
- 2533 W 157th St
- 2529 W 156th St
- 2540 W 156th St
- 2501 W 156th St