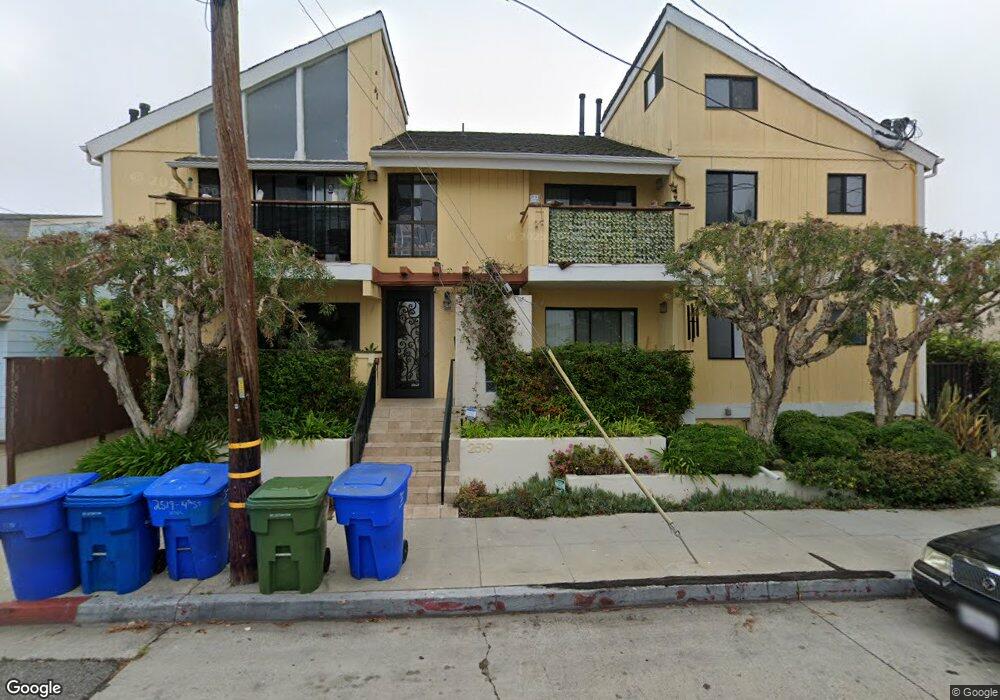
2519 4th St Unit 11 Santa Monica, CA 90405
Ocean Park NeighborhoodEstimated Value: $540,000 - $692,000
1
Bed
1
Bath
562
Sq Ft
$1,086/Sq Ft
Est. Value
About This Home
This home is located at 2519 4th St Unit 11, Santa Monica, CA 90405 and is currently estimated at $610,559, approximately $1,086 per square foot. 2519 4th St Unit 11 is a home located in Los Angeles County with nearby schools including John Muir Elementary School, John Adams Middle School, and Santa Monica High School.
Ownership History
Date
Name
Owned For
Owner Type
Purchase Details
Closed on
Jul 24, 2000
Sold by
Parke William E
Bought by
Wiener Neal
Current Estimated Value
Home Financials for this Owner
Home Financials are based on the most recent Mortgage that was taken out on this home.
Original Mortgage
$100,000
Outstanding Balance
$35,580
Interest Rate
8.15%
Estimated Equity
$574,979
Purchase Details
Closed on
Nov 1, 1996
Sold by
Parke Cecily
Bought by
Parke William E
Home Financials for this Owner
Home Financials are based on the most recent Mortgage that was taken out on this home.
Original Mortgage
$96,600
Interest Rate
8.99%
Purchase Details
Closed on
Oct 31, 1996
Sold by
Trust Rothbart Gracia A Tr M And G Rothb
Bought by
Parke William E
Home Financials for this Owner
Home Financials are based on the most recent Mortgage that was taken out on this home.
Original Mortgage
$96,600
Interest Rate
8.99%
Purchase Details
Closed on
Aug 20, 1993
Sold by
Downing James R and Downing Marguerite N
Bought by
Downing James R and Downing Marguerite N
Create a Home Valuation Report for This Property
The Home Valuation Report is an in-depth analysis detailing your home's value as well as a comparison with similar homes in the area
Home Values in the Area
Average Home Value in this Area
Purchase History
| Date | Buyer | Sale Price | Title Company |
|---|---|---|---|
| Wiener Neal | $125,000 | Southland Title | |
| Parke William E | -- | Investors Title Company | |
| Parke William E | $138,000 | Investors Title Company | |
| Downing James R | -- | -- |
Source: Public Records
Mortgage History
| Date | Status | Borrower | Loan Amount |
|---|---|---|---|
| Open | Wiener Neal | $100,000 | |
| Previous Owner | Parke William E | $96,600 |
Source: Public Records
Tax History Compared to Growth
Tax History
| Year | Tax Paid | Tax Assessment Tax Assessment Total Assessment is a certain percentage of the fair market value that is determined by local assessors to be the total taxable value of land and additions on the property. | Land | Improvement |
|---|---|---|---|---|
| 2025 | $2,744 | $188,334 | $80,908 | $107,426 |
| 2024 | $2,744 | $184,642 | $79,322 | $105,320 |
| 2023 | $2,696 | $181,022 | $77,767 | $103,255 |
| 2022 | $2,647 | $177,474 | $76,243 | $101,231 |
| 2021 | $2,558 | $173,996 | $74,749 | $99,247 |
| 2020 | $2,538 | $172,213 | $73,983 | $98,230 |
| 2019 | $2,504 | $168,837 | $72,533 | $96,304 |
| 2018 | $2,366 | $165,527 | $71,111 | $94,416 |
| 2016 | $2,267 | $159,100 | $68,350 | $90,750 |
| 2015 | $2,234 | $156,711 | $67,324 | $89,387 |
| 2014 | $2,217 | $153,643 | $66,006 | $87,637 |
Source: Public Records
Map
Nearby Homes
- 2454 4th St Unit 5
- 2431 3rd St Unit 10
- 2613 5th St
- 235 Ocean Park Blvd Unit 1
- 235 Ocean Park Blvd Unit 2
- 2644 5th St
- 2530 Beverley Ave
- 2620 2nd St
- 2622 2nd St Unit 2
- 2311 4th St Unit 205
- 649 Ocean Park Blvd
- 2222 5th St Unit 102
- 709 Ocean Park Blvd
- 2203 3rd St Unit 1
- 2817 3rd St Unit 4
- 160 Wadsworth Ave
- 140 Ocean Park Blvd Unit 419
- 110 Ocean Park Blvd Unit 213
- 110 Ocean Park Blvd Unit 505
- 133 Ocean Park Blvd
- 2519 4th St Unit 12
- 2519 4th St Unit 10
- 2519 4th St Unit 9
- 2519 4th St Unit 8
- 2519 4th St Unit 7
- 2519 4th St Unit 6
- 2519 4th St Unit 5
- 2519 4th St Unit 4
- 2519 4th St Unit 3
- 2519 4th St Unit 2
- 2519 4th St Unit 1
- 2525 4th St
- 411 Ocean Park Blvd
- 417 Ocean Park Blvd
- 421 Ocean Park Blvd
- 417 Ocean Park Blvd Unit A
- 417 Ocean Park Blvd Unit 421A
- 2532 5th St
- 2526 5th St
- 2505 4th St