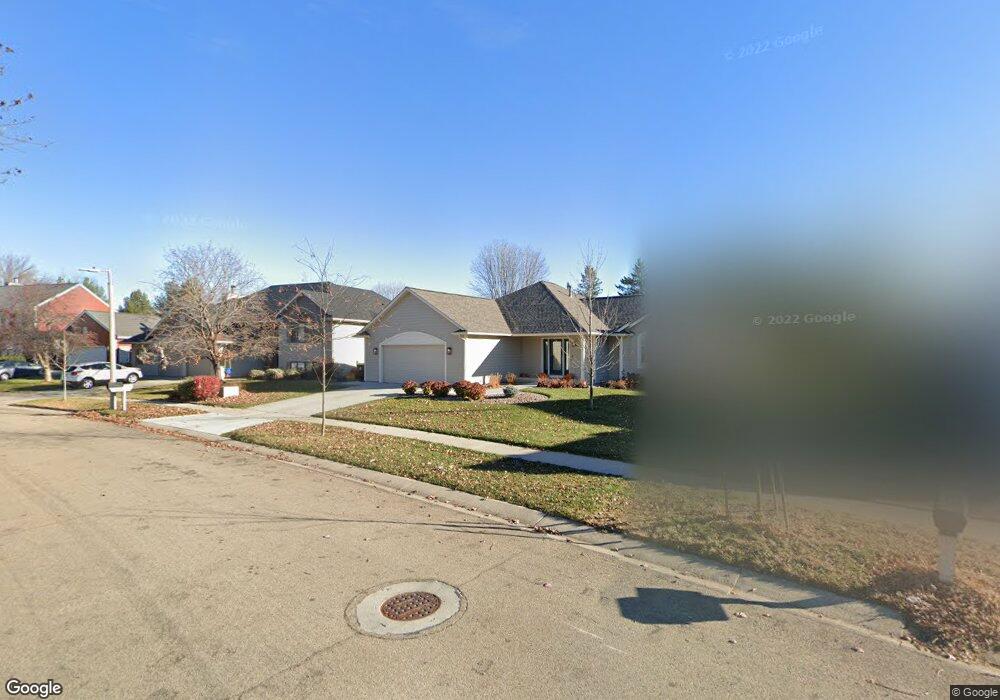
2519 Mayowood Ln SW Rochester, MN 55902
Estimated Value: $442,381 - $494,000
4
Beds
2
Baths
1,401
Sq Ft
$331/Sq Ft
Est. Value
About This Home
This home is located at 2519 Mayowood Ln SW, Rochester, MN 55902 and is currently estimated at $464,095, approximately $331 per square foot. 2519 Mayowood Ln SW is a home located in Olmsted County with nearby schools including Bamber Valley Elementary School, John Adams Middle School, and Mayo Senior High School.
Ownership History
Date
Name
Owned For
Owner Type
Purchase Details
Closed on
Oct 23, 2023
Sold by
Jc Custom Homes Llc
Bought by
Kim Eric J and Kim Eunji L
Current Estimated Value
Home Financials for this Owner
Home Financials are based on the most recent Mortgage that was taken out on this home.
Original Mortgage
$369,000
Outstanding Balance
$360,074
Interest Rate
6.25%
Mortgage Type
New Conventional
Estimated Equity
$104,021
Purchase Details
Closed on
Sep 3, 2021
Sold by
Bisbey Julie R and Bisbey Roger S
Bought by
Jc Custom Homes Llc
Home Financials for this Owner
Home Financials are based on the most recent Mortgage that was taken out on this home.
Original Mortgage
$308,000
Interest Rate
2.8%
Mortgage Type
Commercial
Purchase Details
Closed on
Jan 7, 2020
Sold by
Bisbey Roger and Bisbey Julie
Bought by
Bisbey Julie R and Bisbey Roger S
Purchase Details
Closed on
May 18, 2018
Sold by
Wurst John John
Bought by
Bisbey Roger Roger and Bisbey Julie Julie
Create a Home Valuation Report for This Property
The Home Valuation Report is an in-depth analysis detailing your home's value as well as a comparison with similar homes in the area
Home Values in the Area
Average Home Value in this Area
Purchase History
| Date | Buyer | Sale Price | Title Company |
|---|---|---|---|
| Kim Eric J | $410,000 | Rochester Title | |
| Jc Custom Homes Llc | $385,000 | Rochester Title | |
| Bisbey Julie R | -- | None Available | |
| Bisbey Roger Roger | $299,900 | -- | |
| Bisbey Roger | $299,900 | Rochester Title & Escrow Co |
Source: Public Records
Mortgage History
| Date | Status | Borrower | Loan Amount |
|---|---|---|---|
| Open | Kim Eric J | $369,000 | |
| Previous Owner | Jc Custom Homes Llc | $308,000 |
Source: Public Records
Tax History Compared to Growth
Tax History
| Year | Tax Paid | Tax Assessment Tax Assessment Total Assessment is a certain percentage of the fair market value that is determined by local assessors to be the total taxable value of land and additions on the property. | Land | Improvement |
|---|---|---|---|---|
| 2024 | $5,404 | $391,200 | $60,000 | $331,200 |
| 2023 | $4,702 | $376,200 | $50,000 | $326,200 |
| 2022 | $4,008 | $334,900 | $50,000 | $284,900 |
| 2021 | $3,748 | $300,200 | $50,000 | $250,200 |
| 2020 | $3,766 | $282,200 | $30,000 | $252,200 |
| 2019 | $3,098 | $273,100 | $30,000 | $243,100 |
| 2018 | $2,870 | $230,800 | $27,600 | $203,200 |
| 2017 | $2,836 | $217,000 | $27,600 | $189,400 |
| 2016 | $2,558 | $191,400 | $25,200 | $166,200 |
| 2015 | $2,352 | $168,600 | $24,600 | $144,000 |
| 2014 | $2,310 | $165,500 | $24,600 | $140,900 |
| 2012 | -- | $166,500 | $22,895 | $143,605 |
Source: Public Records
Map
Nearby Homes
- 1941 Waterford Place SW
- 3125 Glenwood Rd SW
- 2961 Glenwood Rd SW
- 3177 Glenwood Rd SW
- 1568 Salem Ct SW
- 2449 Salem Heights Ln SW
- 1814 Mayowood Rd SW
- 1810 Mayowood Rd SW
- 3018 Mayowood Common Cir SW
- 1726 Mayowood Rd SW
- 1710 Mayowood Ct SW
- 1911 Greenfield Ln SW Unit E
- 1650 Mayowood Ct SW
- 1702 Mayowood Ct SW
- 1658 Mayowood Ct SW
- 1750 Mayowood Rd SW
- 1758 Mayowood Rd SW
- 1739 Mayowood Ct SW
- 2229 Ponderosa Dr SW
- 1782 Mayowood Ct SW
- 2527 Mayowood Ln SW
- 2503 Mayowood Ln SW
- 2514 Mayowood Ln SW
- 2520 Mayowood Ln SW
- 2609 Mayowood Ln SW
- 2606 Mayowood Ln SW
- 2506 Mayowood Ln SW
- 1957 Waterford Place SW
- 1955 Waterford Place SW
- 1973 Waterford Place SW
- 3972 Mayowood Rd SW
- 1945 Waterford Place SW
- 1953 Waterford Place SW
- 2616 Mayowood Ln SW
- 2605 Bamber Ln SW
- 1951 Waterford Place SW
- 1935 Waterford Place SW
- 2601 Bamber Ln SW
- 1977 Waterford Place SW
- 2615 Mayowood Ln SW