
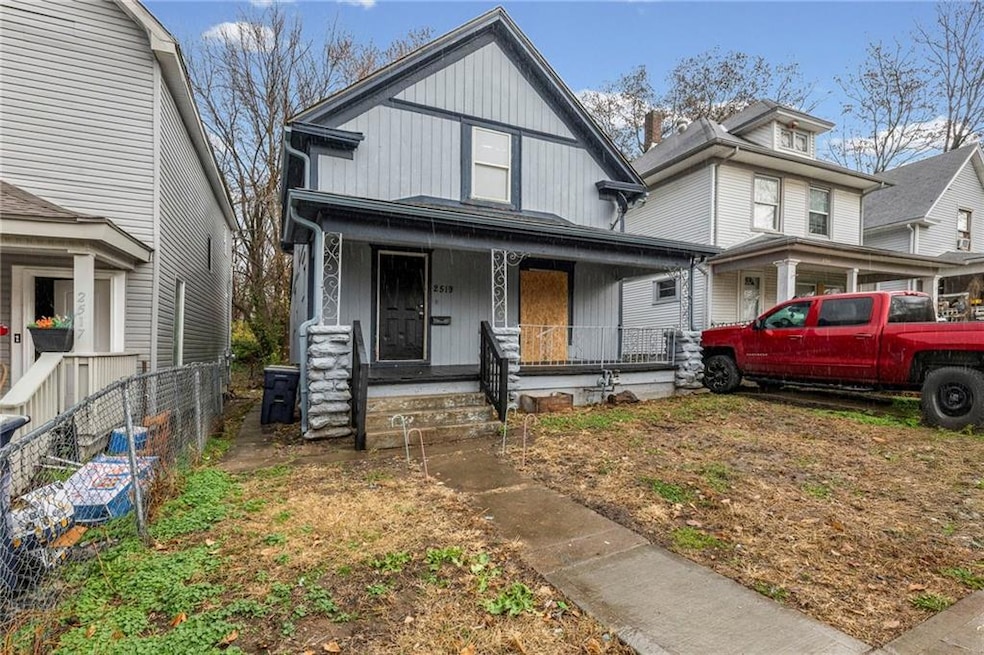
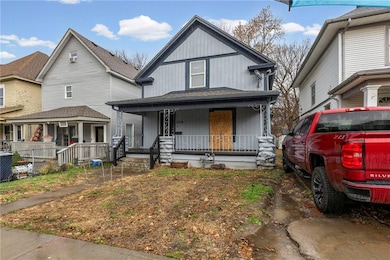
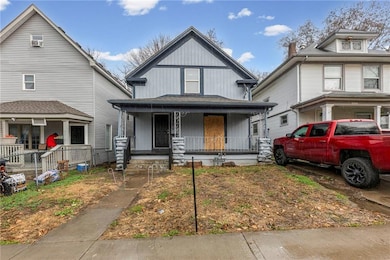
2519 Montgall Ave Kansas City, MO 64127
Washington Wheatley NeighborhoodEstimated payment $815/month
Total Views
3,032
2
Beds
1
Bath
1,950
Sq Ft
$72
Price per Sq Ft
Highlights
- No HOA
- Forced Air Heating and Cooling System
- Wood Siding
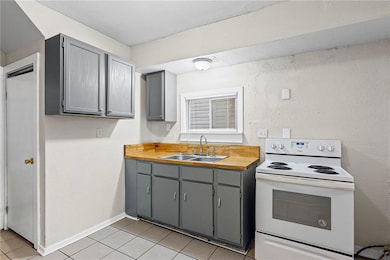
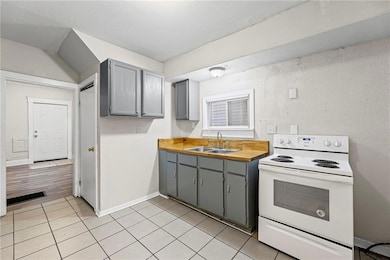
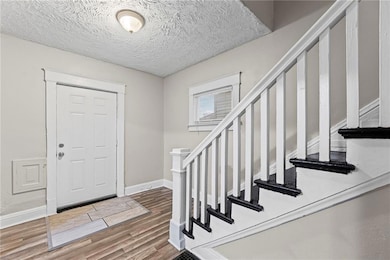
About This Home
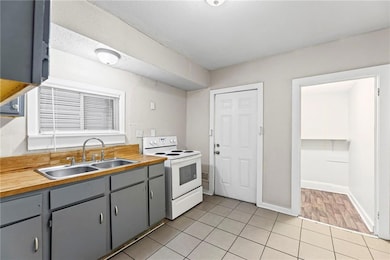
Charming 2-story single-family home offering 3 bedrooms and 1 full bathroom. The main level features vinyl flooring, neutral paint, and a comfortable layout with one bedroom on the main level plus main-floor laundry for added convenience. The kitchen includes an electric stove and refrigerator, making the home functional and move-in ready. Upstairs you’ll find two additional bedrooms and a spacious full bath with great natural light. The home includes window blinds throughout, fresh interior paint, and tall ceilings. Ideal for investors or buyers seeking an affordable property with strong rental potential and convenient access to downtown and nearby redevelopment. Professional photos will be uploaded Tuesday.
Home Details
Home Type
- Single Family
Est. Annual Taxes
- $941
Year Built
- Built in 1900
Home Design
- Composition Roof
- Wood Siding
Interior Spaces
- 1.5-Story Property
- Unfinished Basement
Bedrooms and Bathrooms
- 2 Bedrooms
- 1 Full Bathroom
Additional Features
- 4,634 Sq Ft Lot
- Forced Air Heating and Cooling System
Community Details
- No Home Owners Association
- Association fees include building maint
- Prospect Park Subdivision
Listing and Financial Details
- Assessor Parcel Number 28-430-27-12-00-0-00-000
- $0 special tax assessment
Map
Create a Home Valuation Report for This Property
The Home Valuation Report is an in-depth analysis detailing your home's value as well as a comparison with similar homes in the area
Home Values in the Area
Average Home Value in this Area
Tax History
| Year | Tax Paid | Tax Assessment Tax Assessment Total Assessment is a certain percentage of the fair market value that is determined by local assessors to be the total taxable value of land and additions on the property. | Land | Improvement |
|---|---|---|---|---|
| 2025 | $941 | $13,701 | $1,142 | $12,559 |
| 2024 | $932 | $11,919 | $374 | $11,545 |
| 2023 | $932 | $11,919 | $310 | $11,609 |
| 2022 | $281 | $3,420 | $466 | $2,954 |
| 2021 | $280 | $3,420 | $466 | $2,954 |
| 2020 | $282 | $3,392 | $466 | $2,926 |
| 2019 | $276 | $3,392 | $466 | $2,926 |
| 2018 | $216 | $2,715 | $236 | $2,479 |
| 2017 | $216 | $2,715 | $236 | $2,479 |
| 2016 | $189 | $2,360 | $323 | $2,037 |
| 2014 | $190 | $2,360 | $323 | $2,037 |
Source: Public Records
Property History
| Date | Event | Price | List to Sale | Price per Sq Ft |
|---|---|---|---|---|
| 11/21/2025 11/21/25 | For Sale | $140,000 | -- | $72 / Sq Ft |
Source: Heartland MLS
Purchase History
| Date | Type | Sale Price | Title Company |
|---|---|---|---|
| Warranty Deed | -- | First American Title | |
| Warranty Deed | -- | First American Title | |
| Warranty Deed | -- | None Listed On Document | |
| Warranty Deed | -- | None Listed On Document | |
| Warranty Deed | -- | None Listed On Document | |
| Trustee Deed | $17,194 | First American Title Ins Co | |
| Warranty Deed | -- | Clear Title Nationwide Inc | |
| Warranty Deed | -- | Clear Title |
Source: Public Records
Mortgage History
| Date | Status | Loan Amount | Loan Type |
|---|---|---|---|
| Previous Owner | $36,141 | Future Advance Clause Open End Mortgage |
Source: Public Records
About the Listing Agent
Buying or selling a home can be a frustrating experience if you don’t have the right team in place. You need a realtor who listens to your wants and needs. You need a lender who can work within your personal parameters. You need a home inspector who can get you the answers you need quickly…and the list goes on!
It takes much more than one person to buy or sell a home! At Webb Pointe Homes, we make it our business to assemble the best team of people possible to ensure we are meeting
Jeannine's Other Listings
Source: Heartland MLS
MLS Number: 2588813
APN: 28-430-27-12-00-0-00-000
Disclaimer: Certain information contained herein is derived from information provided by parties other than Homes.com. All information provided is deemed reliable, but is not guaranteed to be accurate and should be independently verified.
![]() Based on information submitted to the MLS GRID as of [see last changed date above]. All data is obtained from various sources and may not have been verified by broker or MLS GRID. Supplied Open House Information is subject to change without notice. All information should be independently reviewed and verified for accuracy. Properties may or may not be listed by the office/agent presenting the information. Some IDX listings have been excluded from this website. Prices displayed on all Sold listings are the Last Known Listing Price and may not be the actual selling price.
Based on information submitted to the MLS GRID as of [see last changed date above]. All data is obtained from various sources and may not have been verified by broker or MLS GRID. Supplied Open House Information is subject to change without notice. All information should be independently reviewed and verified for accuracy. Properties may or may not be listed by the office/agent presenting the information. Some IDX listings have been excluded from this website. Prices displayed on all Sold listings are the Last Known Listing Price and may not be the actual selling price.
Listing Information presented by local MLS brokerage: TEN-X, INC., local REALTOR®- Arlene Richardson - (888)952-6393
The Digital Millennium Copyright Act of 1998, 17 U.S.C. § 512 (the “DMCA”) provides recourse for copyright owners who believe that material appearing on the Internet infringes their rights under U.S. copyright law. If you believe in good faith that any content or material made available in connection with our website or services infringes your copyright, you (or your agent) may send us a notice requesting that the content or material be removed, or access to it blocked.
Notices must be sent in writing by email to DMCAnotice@MLSGrid.com.
The DMCA requires that your notice of alleged copyright infringement include the following information:
(1) description of the copyrighted work that is the subject of claimed infringement;
(2) description of the alleged infringing content and information sufficient to permit us to locate the content;
(3) contact information for you, including your address, telephone number and email address;
(4) a statement by you that you have a good faith belief that the content in the manner complained of is not authorized by the copyright owner, or its agent, or by the operation of any law;
(5) a statement by you, signed under penalty of perjury, that the information in the notification is accurate and that you have the authority to enforce the copyrights that are claimed to be infringed; and
(6) a physical or electronic signature of the copyright owner or a person authorized to act on the copyright owner’s behalf. Failure to include all of the above information may result in the delay of the processing of your complaint.
Nearby Homes
- 2444 Montgall Ave
- 3424 E 24th Terrace
- 2445 Wabash Ave
- 2625 Benton Blvd
- 2528 Olive St
- 2532 Olive St
- 2331 Montgall Ave
- 2708 Benton Blvd
- 2713-2715 Benton Blvd
- 2707 Park Ave
- 2522 College Ave
- 2612 Brooklyn Ave
- 2736 Olive St
- 3207 E 27th St
- 2631 College Ave
- 2734 Park Ave
- 2729 Brooklyn Ave
- 2125 Montgall Ave
- 2416 E 22nd St
- 2746 Brooklyn Ave
- 2524 Askew Ave
- 3001 Agnes Ave Unit B
- 3001 Agnes Ave
- 2018 E 30th St
- 2825 Askew Ave
- 3211 E 30 Terrace
- 3044 E 32 St
- 2101 Vine St
- 3029 Woodland Ave
- 2120 Linwood Blvd Unit 2120 E. Linwood Blvd
- 2608 W Paseo Blvd
- 1901 Vine St
- 2697 Troost Ave
- 2600 Harrison St
- 2729 Campbell St
- 915 E 29th St
- 3035 Harrison St
- 2706 E 36th St
- 2547 Cherry St
- 2832 Peery Ave Unit 2