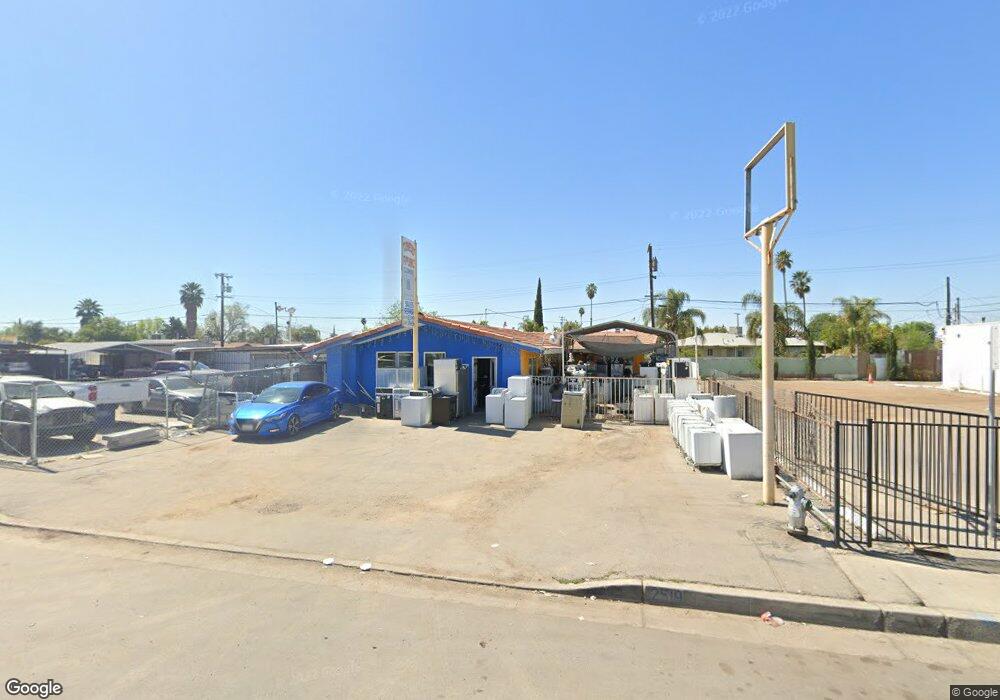
2519 S Chester Ave Bakersfield, CA 93304
Wible Orchard NeighborhoodEstimated Value: $439,403
--
Bed
--
Bath
1,959
Sq Ft
$224/Sq Ft
Est. Value
About This Home
This home is located at 2519 S Chester Ave, Bakersfield, CA 93304 and is currently estimated at $439,403, approximately $224 per square foot. 2519 S Chester Ave is a home located in Kern County with nearby schools including Frank West Elementary School, Curran Middle School, and South High School.
Ownership History
Date
Name
Owned For
Owner Type
Purchase Details
Closed on
Sep 19, 2022
Sold by
Vaughn Wayne L and Vaughn Wayne Lee
Bought by
Bautista Guillermo
Current Estimated Value
Purchase Details
Closed on
Jun 12, 2015
Sold by
Habbad Ghaleb H
Bought by
Estate Of Wayne Lee Vaugh Sr
Purchase Details
Closed on
Nov 12, 2014
Sold by
Haddad Hazqial Nasser and Haddad Ghaleb H
Bought by
Haddad Nader H
Purchase Details
Closed on
Oct 21, 2009
Sold by
Haddad Nader H and Haddad Manal N
Bought by
Haddad Hazaial Nasser and Haddad Ghaleb
Purchase Details
Closed on
Aug 2, 2005
Sold by
Haddad Ghaleb H
Bought by
Haddad Nader H and Haddad Manal N
Purchase Details
Closed on
Oct 20, 2003
Sold by
Carriage Homes
Bought by
Haddad Ghaleb H
Home Financials for this Owner
Home Financials are based on the most recent Mortgage that was taken out on this home.
Original Mortgage
$125,000
Interest Rate
6.04%
Mortgage Type
Seller Take Back
Create a Home Valuation Report for This Property
The Home Valuation Report is an in-depth analysis detailing your home's value as well as a comparison with similar homes in the area
Home Values in the Area
Average Home Value in this Area
Purchase History
| Date | Buyer | Sale Price | Title Company |
|---|---|---|---|
| Bautista Guillermo | $150,000,000 | None Listed On Document | |
| Estate Of Wayne Lee Vaugh Sr | $164,135 | First American Title | |
| Haddad Nader H | -- | None Available | |
| Haddad Hazaial Nasser | -- | None Available | |
| Haddad Nader H | $125,000 | Ticor Title | |
| Haddad Ghaleb H | $165,000 | First American Title |
Source: Public Records
Mortgage History
| Date | Status | Borrower | Loan Amount |
|---|---|---|---|
| Previous Owner | Haddad Ghaleb H | $125,000 |
Source: Public Records
Tax History Compared to Growth
Tax History
| Year | Tax Paid | Tax Assessment Tax Assessment Total Assessment is a certain percentage of the fair market value that is determined by local assessors to be the total taxable value of land and additions on the property. | Land | Improvement |
|---|---|---|---|---|
| 2025 | $2,460 | $265,200 | $73,440 | $191,760 |
| 2024 | $2,460 | $188,517 | $23,562 | $164,955 |
| 2023 | $2,414 | $184,821 | $23,100 | $161,721 |
| 2022 | $2,373 | $181,198 | $22,648 | $158,550 |
| 2021 | $2,453 | $177,646 | $22,204 | $155,442 |
| 2020 | $2,449 | $175,826 | $21,977 | $153,849 |
| 2019 | $2,406 | $175,826 | $21,977 | $153,849 |
| 2018 | $2,353 | $169,001 | $21,125 | $147,876 |
| 2017 | $2,347 | $165,688 | $20,711 | $144,977 |
| 2016 | $2,141 | $162,440 | $20,305 | $142,135 |
| 2015 | $2,131 | $160,000 | $20,000 | $140,000 |
| 2014 | $1,722 | $126,355 | $10,528 | $115,827 |
Source: Public Records
Map
Nearby Homes
- 2709 Laurel Dr
- 2709 Lee Dr
- 2120 S M St
- 2901 S Chester Ave
- 919 Southgate Dr
- 2905 S Chester Ave
- 708 Geneva Ave
- 1108 Southgate Dr
- 2323 S J St
- 1017 Curtis Dr
- 808 Southgate Dr
- 1016 Meredith Dr
- 3000 S Chester Ave Unit SPC 46
- 3000 S Chester Ave Unit 53
- 3000 S Chester Ave Unit 104
- 3000 S Chester Ave Unit 12
- 2136 Mahoney St
- 1605 Sidney Dr
- 3201 Parkland Ct
- 1512 Southgate Dr
- 2507 S Chester Ave
- 1104 Antonia Way
- 1100 Antonia Way
- 2501 S Chester Ave
- 2525 S Chester Ave
- 1108 Antonia Way
- 2504 S Chester Ave
- 1101 Wilson Rd
- 1101 Antonia Way
- 2500 S Chester Ave
- 2508 S Chester Ave
- 1100 Dorian Dr
- 1112 Antonia Way
- 2512 S Chester Ave
- 1104 Dorian Dr
- 1105 Wilson Rd
- 1105 Antonia Way
- 2516 S Chester Ave
- 1108 Dorian Dr
- 1109 Antonia Way