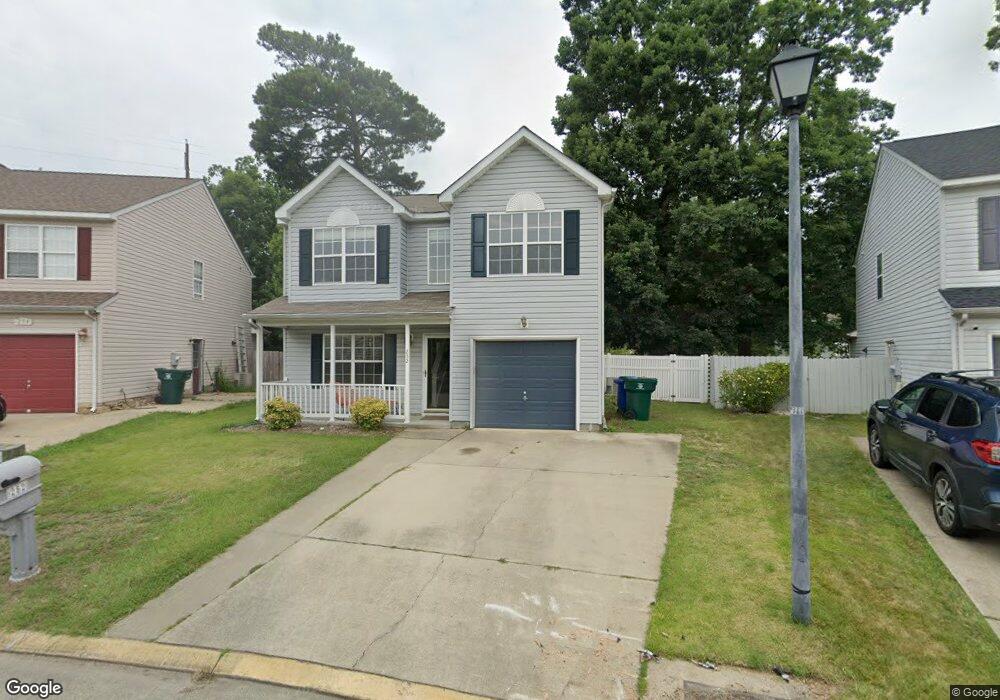
252 Bradmere Loop Newport News, VA 23608
Lee Hall NeighborhoodEstimated Value: $296,000 - $323,000
3
Beds
3
Baths
1,624
Sq Ft
$191/Sq Ft
Est. Value
About This Home
This home is located at 252 Bradmere Loop, Newport News, VA 23608 and is currently estimated at $309,618, approximately $190 per square foot. 252 Bradmere Loop is a home located in Newport News City with nearby schools including Katherine G. Johnson Elementary School, Mary Passage Middle School, and Woodside High School.
Ownership History
Date
Name
Owned For
Owner Type
Purchase Details
Closed on
Dec 20, 2007
Sold by
Winiarski Ted J
Bought by
Brown Michael
Current Estimated Value
Home Financials for this Owner
Home Financials are based on the most recent Mortgage that was taken out on this home.
Original Mortgage
$219,662
Outstanding Balance
$138,407
Interest Rate
6.3%
Mortgage Type
VA
Estimated Equity
$171,211
Purchase Details
Closed on
Aug 22, 2005
Sold by
Mccumsey Bradley A
Bought by
Winiarski Ted J
Home Financials for this Owner
Home Financials are based on the most recent Mortgage that was taken out on this home.
Original Mortgage
$150,800
Interest Rate
5.68%
Mortgage Type
New Conventional
Purchase Details
Closed on
Jul 8, 2002
Sold by
Jordans Crossing L L C
Bought by
Mccumsey Bradley A
Home Financials for this Owner
Home Financials are based on the most recent Mortgage that was taken out on this home.
Original Mortgage
$121,700
Interest Rate
6.64%
Create a Home Valuation Report for This Property
The Home Valuation Report is an in-depth analysis detailing your home's value as well as a comparison with similar homes in the area
Home Values in the Area
Average Home Value in this Area
Purchase History
| Date | Buyer | Sale Price | Title Company |
|---|---|---|---|
| Brown Michael | $215,000 | -- | |
| Winiarski Ted J | $190,000 | -- | |
| Mccumsey Bradley A | $119,325 | -- |
Source: Public Records
Mortgage History
| Date | Status | Borrower | Loan Amount |
|---|---|---|---|
| Open | Brown Michael | $219,662 | |
| Previous Owner | Winiarski Ted J | $150,800 | |
| Previous Owner | Mccumsey Bradley A | $121,700 |
Source: Public Records
Tax History Compared to Growth
Tax History
| Year | Tax Paid | Tax Assessment Tax Assessment Total Assessment is a certain percentage of the fair market value that is determined by local assessors to be the total taxable value of land and additions on the property. | Land | Improvement |
|---|---|---|---|---|
| 2025 | $3,339 | $280,800 | $64,800 | $216,000 |
| 2024 | $3,192 | $270,500 | $64,800 | $205,700 |
| 2023 | $3,160 | $255,300 | $64,800 | $190,500 |
| 2022 | $2,972 | $235,400 | $64,800 | $170,600 |
| 2021 | $2,622 | $214,900 | $54,000 | $160,900 |
| 2020 | $2,674 | $207,100 | $54,000 | $153,100 |
| 2019 | $2,547 | $197,100 | $54,000 | $143,100 |
| 2018 | $2,493 | $192,900 | $54,000 | $138,900 |
| 2017 | $2,396 | $185,000 | $54,000 | $131,000 |
| 2016 | $2,233 | $172,000 | $54,000 | $118,000 |
| 2015 | $2,227 | $172,000 | $54,000 | $118,000 |
| 2014 | $1,991 | $172,000 | $54,000 | $118,000 |
Source: Public Records
Map
Nearby Homes
- 192 S Hunt Club Run
- 211 Old Bridge Ct
- 206 Quarter Trail Unit F
- 204 Quarter Trail Unit C
- 621 McLaw Dr
- 214 Quarter Trail
- 325 Lees Mill Dr
- 217 Rivers Ridge Cir
- 481 Lees Mill Dr
- 478 Rivers Ridge Cir
- 364 Rivers Ridge Cir
- 17247 Warwick Blvd
- 114 Ashton Green Blvd
- 108 W Rexford Dr
- 112 W Rexford Dr
- 431 Old Colonial Way Unit 203
- 91 W Rexford Dr
- 217 Misty Point Ln
- 17317 Warwick Blvd
- 17319 Warwick Blvd
- 254 Bradmere Loop
- 250 Bradmere Loop
- 256 Bradmere Loop
- 248 Bradmere Loop
- 253 Bradmere Loop
- 258 Bradmere Loop
- 257 Bradmere Loop
- 246 Bradmere Loop
- 109 Ripon Way
- 261 Bradmere Loop
- 260 Bradmere Loop
- 244 Bradmere Loop
- 107 Ripon Way
- 182 Lees Mill Dr
- 182 Lees Mill Dr Unit 334
- 181 Lees Mill Dr
- 262 Bradmere Loop
- 263 Bradmere Loop
- 179 Old Bridge Rd
- 242 Bradmere Loop