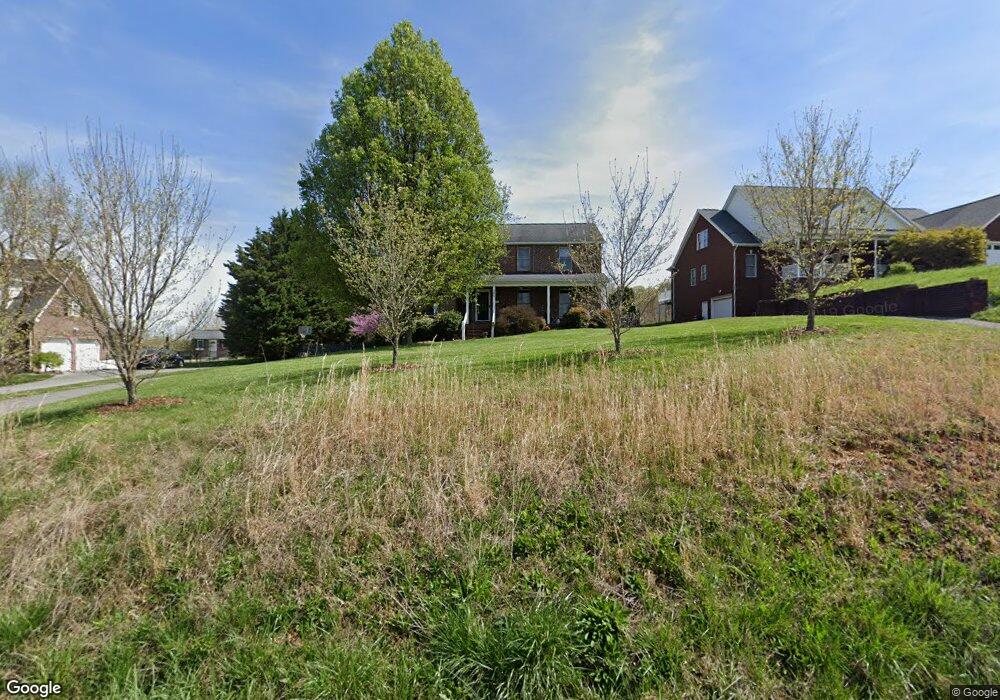
252 Hales Rd Jonesborough, TN 37659
Estimated Value: $526,540 - $643,000
4
Beds
4
Baths
3,165
Sq Ft
$184/Sq Ft
Est. Value
About This Home
This home is located at 252 Hales Rd, Jonesborough, TN 37659 and is currently estimated at $581,885, approximately $183 per square foot. 252 Hales Rd is a home located in Washington County with nearby schools including Jonesborough Elementary School, Jonesborough Middle School, and David Crockett High School.
Ownership History
Date
Name
Owned For
Owner Type
Purchase Details
Closed on
Jun 14, 2006
Sold by
Cook Joel A
Bought by
Roberts Alfred Kirk
Current Estimated Value
Home Financials for this Owner
Home Financials are based on the most recent Mortgage that was taken out on this home.
Original Mortgage
$225,000
Outstanding Balance
$131,094
Interest Rate
6.41%
Estimated Equity
$450,791
Purchase Details
Closed on
Feb 5, 2003
Sold by
Mcclellan Billy C
Bought by
Cook Joel A
Home Financials for this Owner
Home Financials are based on the most recent Mortgage that was taken out on this home.
Original Mortgage
$191,200
Interest Rate
5.89%
Purchase Details
Closed on
Feb 3, 2003
Home Financials for this Owner
Home Financials are based on the most recent Mortgage that was taken out on this home.
Original Mortgage
$191,200
Interest Rate
5.89%
Purchase Details
Closed on
Aug 17, 1998
Sold by
Zeller Helen H
Bought by
Mcclellan Billy
Create a Home Valuation Report for This Property
The Home Valuation Report is an in-depth analysis detailing your home's value as well as a comparison with similar homes in the area
Home Values in the Area
Average Home Value in this Area
Purchase History
| Date | Buyer | Sale Price | Title Company |
|---|---|---|---|
| Roberts Alfred Kirk | $285,000 | -- | |
| Cook Joel A | $239,000 | -- | |
| Mcclellan Billy C | -- | -- | |
| -- | -- | -- | |
| Mcclellan Billy | $15,000 | -- |
Source: Public Records
Mortgage History
| Date | Status | Borrower | Loan Amount |
|---|---|---|---|
| Open | Mcclellan Billy | $225,000 | |
| Previous Owner | Mcclellan Billy | $191,200 |
Source: Public Records
Tax History Compared to Growth
Tax History
| Year | Tax Paid | Tax Assessment Tax Assessment Total Assessment is a certain percentage of the fair market value that is determined by local assessors to be the total taxable value of land and additions on the property. | Land | Improvement |
|---|---|---|---|---|
| 2024 | $1,980 | $115,800 | $6,325 | $109,475 |
| 2022 | $1,547 | $71,975 | $6,325 | $65,650 |
| 2021 | $1,547 | $71,975 | $6,325 | $65,650 |
| 2020 | $1,547 | $71,975 | $6,325 | $65,650 |
| 2019 | $1,646 | $71,975 | $6,325 | $65,650 |
| 2018 | $1,646 | $69,150 | $6,325 | $62,825 |
| 2017 | $1,646 | $69,150 | $6,325 | $62,825 |
| 2016 | $1,646 | $69,150 | $6,325 | $62,825 |
| 2015 | $1,369 | $69,150 | $6,325 | $62,825 |
| 2014 | $1,369 | $69,150 | $6,325 | $62,825 |
Source: Public Records
Map
Nearby Homes
- 603 Tavern Hill Rd
- 165 Slonaker Cir
- 73 Slonaker Cir
- 79 Slonaker Cir
- 92 Slonaker Cir
- 711 Tavern Hill Rd
- 826 Hairetown Rd
- 816 Hairetown Rd
- 769 Twilight Falls
- 755 Twilight Falls
- 926 Daybreak Crest
- 700 Twilight Falls
- 920 Daybreak Crest
- 551 Middays Rest
- 699 Twilight Falls
- 107 Carriage Ln
- 440 English Ivy Trail
- Lot 49 English Ivy Trail
- 825 Old Boones Creek Rd
- Lot 45 English Ivy Trail