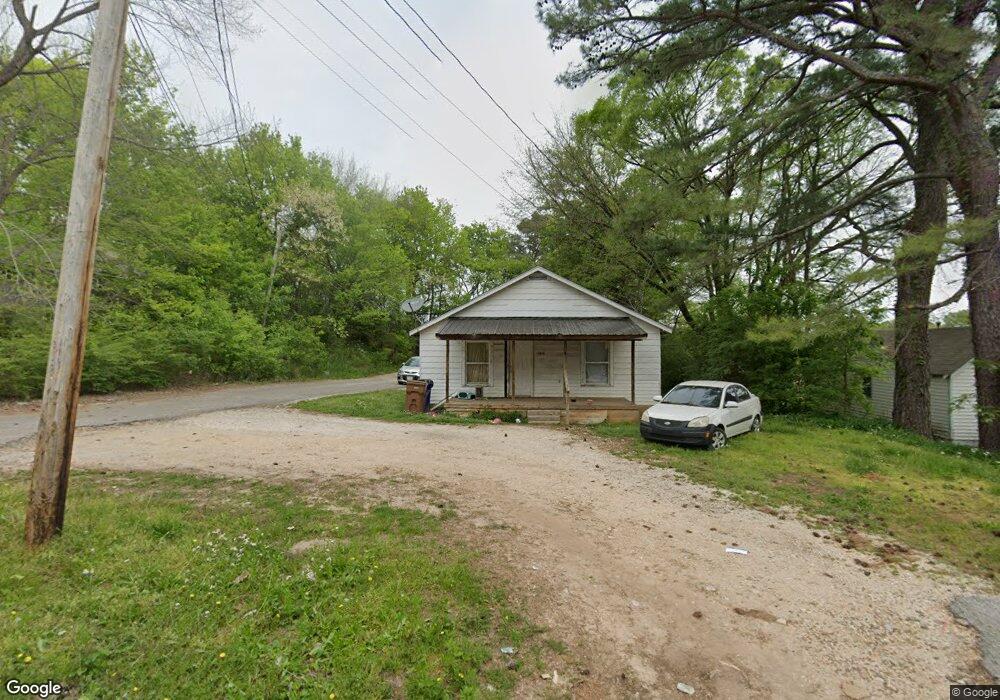
252 N Main St Lexington, TN 38351
Estimated Value: $82,000 - $110,811
2
Beds
1
Bath
696
Sq Ft
$137/Sq Ft
Est. Value
About This Home
This home is located at 252 N Main St, Lexington, TN 38351 and is currently estimated at $95,453, approximately $137 per square foot. 252 N Main St is a home located in Henderson County with nearby schools including Paul G. Caywood Elementary School, Lexington Middle School, and Lexington Montessori Center.
Ownership History
Date
Name
Owned For
Owner Type
Purchase Details
Closed on
Jan 25, 2012
Sold by
Cannon Bryon
Bought by
Distinct Contracting Llc
Current Estimated Value
Purchase Details
Closed on
Jul 30, 2007
Sold by
Edward Wayne Revocable Tr
Bought by
Bryon Cannon
Purchase Details
Closed on
Jun 5, 2007
Sold by
Teague Edward W
Bought by
Edward Wayne T Revocable Trust
Purchase Details
Closed on
Jan 10, 2007
Sold by
John Coffey
Bought by
Horne John G
Purchase Details
Closed on
Aug 14, 1992
Purchase Details
Closed on
Aug 9, 1974
Bought by
Keen Ola M
Create a Home Valuation Report for This Property
The Home Valuation Report is an in-depth analysis detailing your home's value as well as a comparison with similar homes in the area
Home Values in the Area
Average Home Value in this Area
Purchase History
| Date | Buyer | Sale Price | Title Company |
|---|---|---|---|
| Distinct Contracting Llc | $32,000 | -- | |
| Bryon Cannon | $25,000 | -- | |
| Edward Wayne T Revocable Trust | -- | -- | |
| Horne John G | $9,500 | -- | |
| -- | $15,000 | -- | |
| Keen Ola M | -- | -- |
Source: Public Records
Tax History Compared to Growth
Tax History
| Year | Tax Paid | Tax Assessment Tax Assessment Total Assessment is a certain percentage of the fair market value that is determined by local assessors to be the total taxable value of land and additions on the property. | Land | Improvement |
|---|---|---|---|---|
| 2024 | $875 | $35,000 | $2,200 | $32,800 |
| 2023 | $875 | $35,000 | $2,200 | $32,800 |
| 2022 | $727 | $21,480 | $2,200 | $19,280 |
| 2021 | $727 | $21,480 | $2,200 | $19,280 |
| 2020 | $727 | $21,480 | $2,200 | $19,280 |
| 2019 | $727 | $21,480 | $2,200 | $19,280 |
| 2018 | $749 | $21,480 | $2,200 | $19,280 |
| 2017 | $749 | $21,480 | $2,200 | $19,280 |
| 2016 | $444 | $12,320 | $2,200 | $10,120 |
| 2015 | $404 | $11,200 | $1,375 | $9,825 |
| 2014 | $403 | $11,188 | $0 | $0 |
Source: Public Records
Map
Nearby Homes