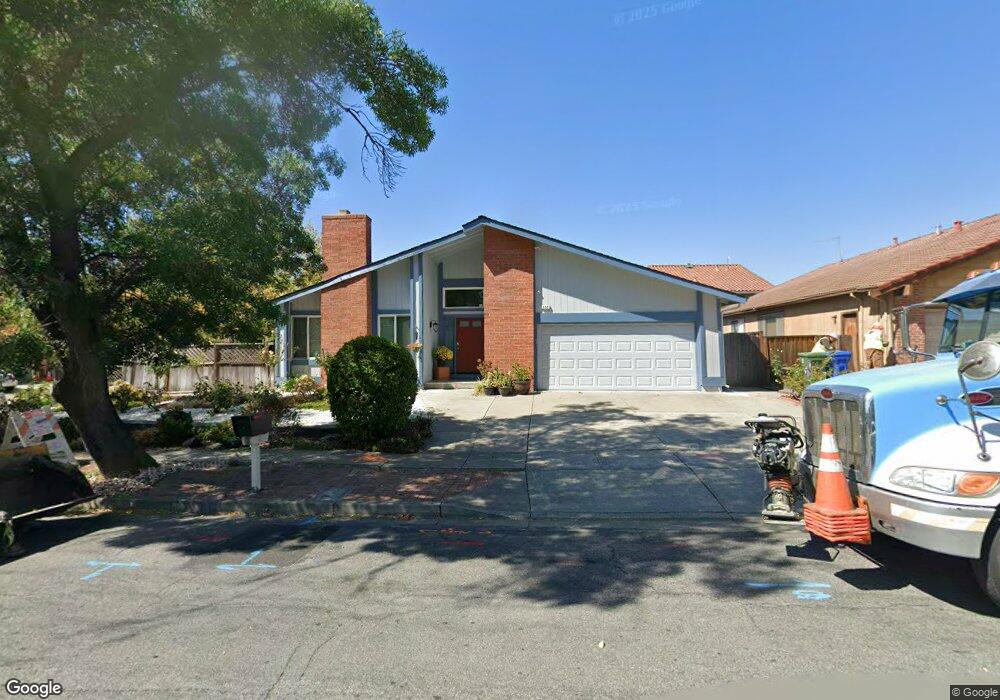
252 Tonopah Dr Fremont, CA 94539
Warm Springs NeighborhoodEstimated Value: $1,814,000 - $2,373,000
4
Beds
2
Baths
1,866
Sq Ft
$1,148/Sq Ft
Est. Value
About This Home
This home is located at 252 Tonopah Dr, Fremont, CA 94539 and is currently estimated at $2,142,238, approximately $1,148 per square foot. 252 Tonopah Dr is a home located in Alameda County with nearby schools including Warm Springs Elementary School, James Leitch Elementary School, and John M. Horner Junior High School.
Ownership History
Date
Name
Owned For
Owner Type
Purchase Details
Closed on
Dec 1, 2015
Sold by
Mittal Pavan and Pathak Neena
Bought by
Mittal Family Revocable Trust
Current Estimated Value
Purchase Details
Closed on
Nov 2, 2015
Sold by
Mittal Pavan and Pathak Neena
Bought by
Mittal Pavan and Pathak Neena
Purchase Details
Closed on
Apr 18, 2015
Sold by
Mittal Pavan and Pathak Neena
Bought by
Mittal Pavan and Pathak Neena
Purchase Details
Closed on
Jul 29, 2014
Sold by
Koehler Glenn A and Koehler Marilyn J
Bought by
Mittal Pavan and Pathak Neena
Home Financials for this Owner
Home Financials are based on the most recent Mortgage that was taken out on this home.
Original Mortgage
$888,000
Outstanding Balance
$749,593
Interest Rate
3.5%
Mortgage Type
Adjustable Rate Mortgage/ARM
Estimated Equity
$1,392,645
Purchase Details
Closed on
Jul 25, 2012
Sold by
Koehler Glenn A and Koehler Marilyn J
Bought by
Koehler Glenn A and Koehler Marilyn J
Create a Home Valuation Report for This Property
The Home Valuation Report is an in-depth analysis detailing your home's value as well as a comparison with similar homes in the area
Home Values in the Area
Average Home Value in this Area
Purchase History
| Date | Buyer | Sale Price | Title Company |
|---|---|---|---|
| Mittal Family Revocable Trust | -- | Stewart Title Of Ca Inc | |
| Mittal Pavan | -- | Stewart Title Of Ca Inc | |
| Mittal Pavan | -- | None Available | |
| Mittal Pavan | $1,110,000 | Fidelity National Title Co | |
| Koehler Glenn A | -- | None Available | |
| Koehler Glenn A | -- | None Available |
Source: Public Records
Mortgage History
| Date | Status | Borrower | Loan Amount |
|---|---|---|---|
| Open | Mittal Pavan | $888,000 |
Source: Public Records
Tax History Compared to Growth
Tax History
| Year | Tax Paid | Tax Assessment Tax Assessment Total Assessment is a certain percentage of the fair market value that is determined by local assessors to be the total taxable value of land and additions on the property. | Land | Improvement |
|---|---|---|---|---|
| 2025 | $15,562 | $1,327,008 | $400,202 | $933,806 |
| 2024 | $15,562 | $1,300,857 | $392,357 | $915,500 |
| 2023 | $15,157 | $1,282,215 | $384,664 | $897,551 |
| 2022 | $14,980 | $1,250,074 | $377,122 | $879,952 |
| 2021 | $14,607 | $1,225,432 | $369,729 | $862,703 |
| 2020 | $14,709 | $1,219,800 | $365,940 | $853,860 |
| 2019 | $14,537 | $1,195,891 | $358,767 | $837,124 |
| 2018 | $14,255 | $1,172,448 | $351,734 | $820,714 |
| 2017 | $13,898 | $1,149,460 | $344,838 | $804,622 |
| 2016 | $13,671 | $1,126,927 | $338,078 | $788,849 |
| 2015 | $13,499 | $1,110,000 | $333,000 | $777,000 |
| 2014 | -- | $286,674 | $114,510 | $172,164 |
Source: Public Records
Map
Nearby Homes
- 296 Kansas Way
- 270 Tuolumne Dr
- 48287 Sawleaf St
- 48346 Cottonwood St
- 145 Gamma Grass Terrace Unit U256
- 49002 Cinnamon Fern Common Unit 311
- 49100 Tomahawk Place
- 391 Gross St
- 474 Oliver St
- 60 Wilson Way Unit 171
- 60 Wilson Way Unit 158
- 1830 Vegas Ave
- 1610 Hidden Creek Ln
- 47236 Cavanaugh Common
- 47222 Mission Falls Ct
- 392 Terra Mesa Way
- 281 Hackamore Common
- 182 Rose Dr
- 136 Hackamore Ln Unit 18
- 114 Hackamore Ln Unit 14
- 266 Tonopah Dr
- 48598 Carlsbad Rd
- 280 Tonopah Dr
- 48611 Carlsbad Rd
- 48619 Carlsbad Rd
- 245 Tonopah Dr
- 245 Tonopah Dr
- 48576 Carlsbad Rd
- 48597 Carlsbad Rd
- 255 Tonopah Dr
- 255 Tonopah Dr
- 235 Tonopah Dr
- 294 Tonopah Dr
- 265 Tonopah Dr
- 48605 Spokane Ct
- 48575 Spokane Rd
- 221 Ottawa Way
- 225 Tonopah Dr
- 225 Tonopah Dr
- 48554 Carlsbad Rd