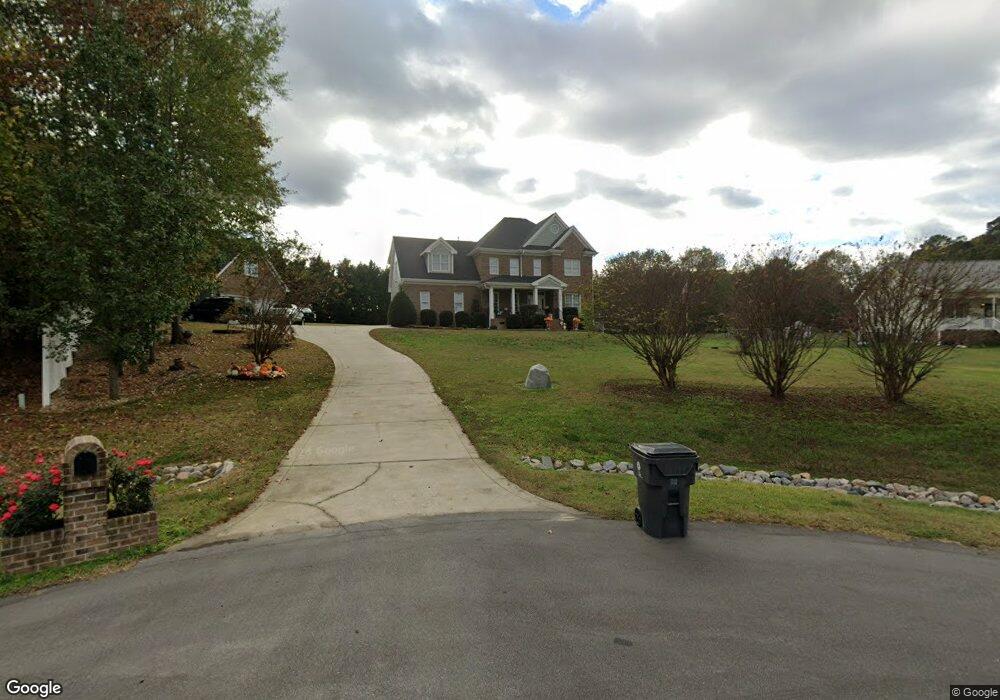
252 Tranquility Ln Knightdale, NC 27545
Estimated Value: $447,000 - $638,000
3
Beds
3
Baths
2,566
Sq Ft
$222/Sq Ft
Est. Value
About This Home
This home is located at 252 Tranquility Ln, Knightdale, NC 27545 and is currently estimated at $569,620, approximately $221 per square foot. 252 Tranquility Ln is a home located in Wake County with nearby schools including Knightdale Elementary School, Neuse River Middle School, and Knightdale High.
Ownership History
Date
Name
Owned For
Owner Type
Purchase Details
Closed on
Dec 29, 2020
Sold by
Moody Greg
Bought by
Moody Jeanie and Cruthoff Jeanie L
Current Estimated Value
Purchase Details
Closed on
May 1, 2012
Sold by
Cruthoff Michael S
Bought by
Cruthoff Jeanie L
Home Financials for this Owner
Home Financials are based on the most recent Mortgage that was taken out on this home.
Original Mortgage
$32,298
Outstanding Balance
$21,792
Interest Rate
3.35%
Mortgage Type
Purchase Money Mortgage
Estimated Equity
$547,828
Purchase Details
Closed on
Oct 17, 2008
Sold by
Lancaster Matthew R and Lancaster Rachael Diener
Bought by
Cruthoff Jeanie Lee and Cruthoff Michael Shawn
Home Financials for this Owner
Home Financials are based on the most recent Mortgage that was taken out on this home.
Original Mortgage
$201,600
Outstanding Balance
$133,479
Interest Rate
6.34%
Mortgage Type
Purchase Money Mortgage
Estimated Equity
$436,141
Create a Home Valuation Report for This Property
The Home Valuation Report is an in-depth analysis detailing your home's value as well as a comparison with similar homes in the area
Home Values in the Area
Average Home Value in this Area
Purchase History
| Date | Buyer | Sale Price | Title Company |
|---|---|---|---|
| Moody Jeanie | -- | None Available | |
| Cruthoff Jeanie L | -- | None Available | |
| Cruthoff Jeanie Lee | $252,000 | None Available |
Source: Public Records
Mortgage History
| Date | Status | Borrower | Loan Amount |
|---|---|---|---|
| Open | Cruthoff Jeanie L | $32,298 | |
| Open | Cruthoff Jeanie Lee | $201,600 |
Source: Public Records
Tax History Compared to Growth
Tax History
| Year | Tax Paid | Tax Assessment Tax Assessment Total Assessment is a certain percentage of the fair market value that is determined by local assessors to be the total taxable value of land and additions on the property. | Land | Improvement |
|---|---|---|---|---|
| 2025 | $3,965 | $616,818 | $85,000 | $531,818 |
| 2024 | $3,850 | $616,818 | $85,000 | $531,818 |
| 2023 | $2,825 | $359,773 | $50,000 | $309,773 |
| 2022 | $2,618 | $359,773 | $50,000 | $309,773 |
| 2021 | $2,548 | $359,773 | $50,000 | $309,773 |
| 2020 | $2,506 | $359,773 | $50,000 | $309,773 |
| 2019 | $2,382 | $289,252 | $50,000 | $239,252 |
| 2018 | $2,191 | $289,252 | $50,000 | $239,252 |
| 2017 | $2,077 | $289,252 | $50,000 | $239,252 |
| 2016 | $2,035 | $289,252 | $50,000 | $239,252 |
| 2015 | $2,062 | $293,972 | $40,000 | $253,972 |
| 2014 | $1,954 | $293,972 | $40,000 | $253,972 |
Source: Public Records
Map
Nearby Homes
- 0 Old Ferrell Rd
- 1305 Shakentown St
- 1317 Sweet Charm Ln
- 3007 S Smithfield Rd
- 404 Ingram Ridge Ct
- 5329 Cottage Bluff Ln
- 5020 Walton Hill Rd
- 1612 Font Hills Ln
- 508 Pine Run
- 521 Marion Hills Way
- 601 Marion Hills Way
- 332 Spruce Pine Trail
- 640 Marion Hills Way
- 105 N Bend Dr
- Jordan Plan at Glenmere - Gardens
- The Willow E Plan at Glenmere - Cove
- 102 N Bend Dr
- 8323 Poole Rd
- 5404 Rutledgeville Ln
- 1028 Roundtable Ct
- 248 Tranquility Ln
- 258 Tranquility Ln
- 249 Tranquility Ln
- 245 Tranquility Ln
- 240 Tranquility Ln
- 241 Tranquility Ln
- 228 Tranquility Ln
- 237 Tranquility Ln
- 233 Tranquility Ln
- 220 Tranquility Ln
- 214 Tranquility Ln
- 210 Tranquility Ln
- 301 Tranquility Ln
- 305 Tranquility Ln
- 304 Tranquility Ln
- 300 Tranquility Ln
- 266 Tranquility Ln
- 206 Tranquility Ln
- 202 Tranquility Ln
- 217 Tranquility Ln