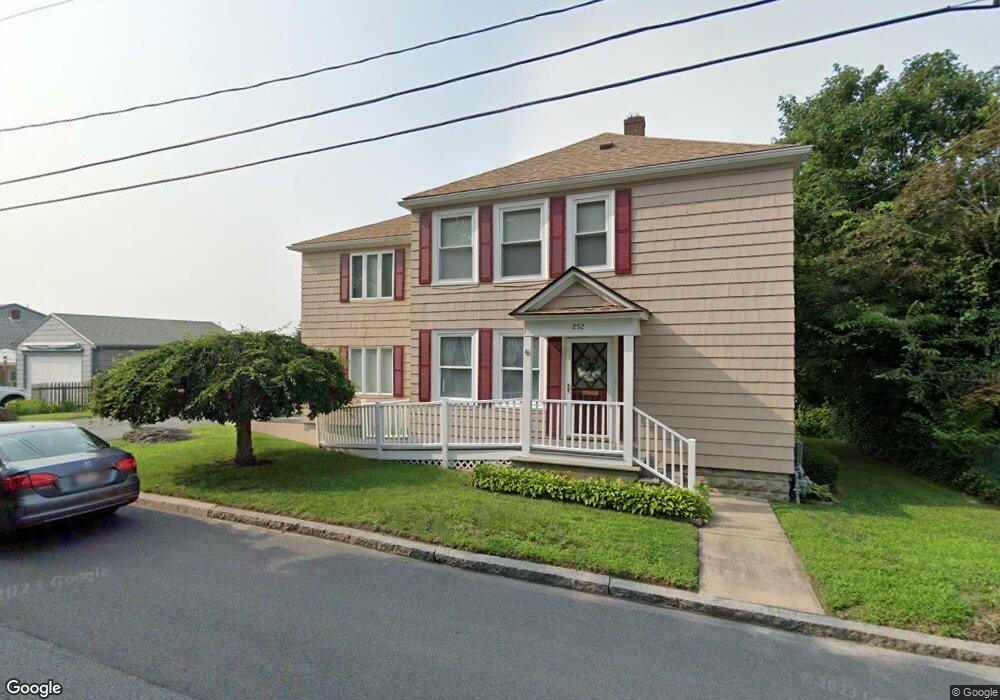
252 Walter St Fall River, MA 02724
Sandy Beach NeighborhoodEstimated Value: $460,452 - $574,000
5
Beds
2
Baths
2,596
Sq Ft
$200/Sq Ft
Est. Value
About This Home
This home is located at 252 Walter St, Fall River, MA 02724 and is currently estimated at $519,863, approximately $200 per square foot. 252 Walter St is a home located in Bristol County with nearby schools including Carlton M. Viveiros Elementary School, Matthew J. Kuss Middle School, and B M C Durfee High School.
Ownership History
Date
Name
Owned For
Owner Type
Purchase Details
Closed on
Sep 15, 2000
Sold by
Berube Norman E and Berube Claire G
Bought by
Berube Normand E
Current Estimated Value
Home Financials for this Owner
Home Financials are based on the most recent Mortgage that was taken out on this home.
Original Mortgage
$140,000
Outstanding Balance
$50,917
Interest Rate
8.07%
Mortgage Type
Purchase Money Mortgage
Estimated Equity
$468,946
Create a Home Valuation Report for This Property
The Home Valuation Report is an in-depth analysis detailing your home's value as well as a comparison with similar homes in the area
Home Values in the Area
Average Home Value in this Area
Purchase History
| Date | Buyer | Sale Price | Title Company |
|---|---|---|---|
| Berube Normand E | $140,000 | -- |
Source: Public Records
Mortgage History
| Date | Status | Borrower | Loan Amount |
|---|---|---|---|
| Open | Berube Normand E | $140,000 |
Source: Public Records
Tax History
| Year | Tax Paid | Tax Assessment Tax Assessment Total Assessment is a certain percentage of the fair market value that is determined by local assessors to be the total taxable value of land and additions on the property. | Land | Improvement |
|---|---|---|---|---|
| 2025 | $4,652 | $406,300 | $116,800 | $289,500 |
| 2024 | $4,301 | $374,300 | $114,500 | $259,800 |
| 2023 | $4,075 | $332,100 | $103,100 | $229,000 |
| 2022 | $3,482 | $301,100 | $97,300 | $203,800 |
| 2021 | $3,482 | $251,800 | $93,000 | $158,800 |
| 2020 | $3,154 | $218,300 | $88,700 | $129,600 |
| 2019 | $3,117 | $213,800 | $92,700 | $121,100 |
| 2018 | $3,010 | $205,900 | $93,400 | $112,500 |
| 2017 | $3,724 | $200,500 | $93,400 | $107,100 |
| 2016 | $2,741 | $201,100 | $96,300 | $104,800 |
| 2015 | $2,632 | $201,200 | $96,300 | $104,900 |
| 2014 | $2,632 | $209,200 | $96,300 | $112,900 |
Source: Public Records
Map
Nearby Homes
- 616 Woodman St
- 126 Wheeler St
- 609 King Philip St
- 2229 S Main St
- 15 Higgins St
- 464 Birch St
- 57 Larouche St
- 1852 S Main St
- 1846 S Main St
- 245 Dwelly St
- 24 Valley St
- 579 Summit St Unit 3
- 579 Summit St Unit 2
- 30 Broad St
- 234 Kilburn St
- 917 Dwelly St
- 391 Clarkson St
- 20 Wilcox St
- 42 Main Rd
- 1334 S Main St
Your Personal Tour Guide
Ask me questions while you tour the home.