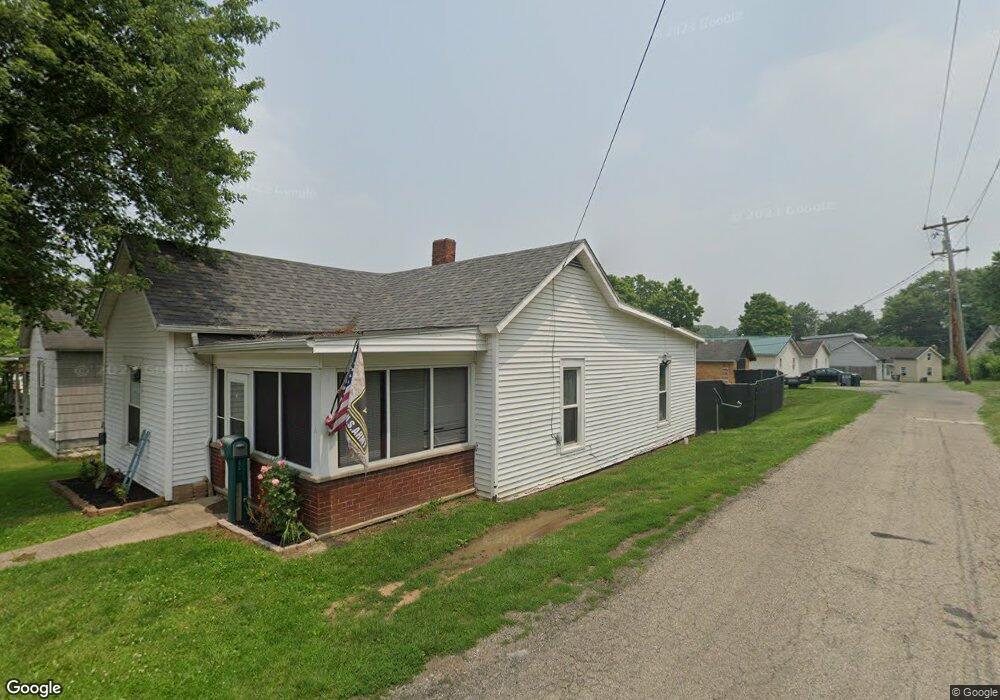
252 West St Jackson, OH 45640
Estimated Value: $124,000 - $137,000
2
Beds
1
Bath
1,160
Sq Ft
$113/Sq Ft
Est. Value
About This Home
This home is located at 252 West St, Jackson, OH 45640 and is currently estimated at $131,333, approximately $113 per square foot. 252 West St is a home located in Jackson County with nearby schools including Jackson High School and Christian Life Academy.
Ownership History
Date
Name
Owned For
Owner Type
Purchase Details
Closed on
May 20, 2010
Sold by
Fannie Mae
Bought by
Jse Investments Inc
Current Estimated Value
Purchase Details
Closed on
Apr 21, 2010
Sold by
Waldron Phyllis J and Gmac Mortgage Llc
Bought by
Federal National Mortgage Association
Purchase Details
Closed on
Jan 3, 2000
Sold by
Roberts Rena
Bought by
Mckinniss Kenneth and Mckinniss Vivian
Purchase Details
Closed on
Sep 3, 1999
Sold by
Lyons Carolyn
Bought by
Roberts Rena
Purchase Details
Closed on
Nov 9, 1995
Sold by
Lyons Martha
Bought by
Lyons Carolyn
Create a Home Valuation Report for This Property
The Home Valuation Report is an in-depth analysis detailing your home's value as well as a comparison with similar homes in the area
Home Values in the Area
Average Home Value in this Area
Purchase History
| Date | Buyer | Sale Price | Title Company |
|---|---|---|---|
| Jse Investments Inc | $27,250 | None Available | |
| Federal National Mortgage Association | $43,333 | Attorney | |
| Mckinniss Kenneth | $28,500 | -- | |
| Roberts Rena | -- | -- | |
| Lyons Carolyn | -- | -- |
Source: Public Records
Tax History Compared to Growth
Tax History
| Year | Tax Paid | Tax Assessment Tax Assessment Total Assessment is a certain percentage of the fair market value that is determined by local assessors to be the total taxable value of land and additions on the property. | Land | Improvement |
|---|---|---|---|---|
| 2024 | $794 | $21,410 | $6,460 | $14,950 |
| 2023 | $808 | $21,410 | $6,460 | $14,950 |
| 2022 | $899 | $17,620 | $6,250 | $11,370 |
| 2021 | $717 | $17,620 | $6,250 | $11,370 |
| 2020 | $711 | $17,620 | $6,250 | $11,370 |
| 2019 | $627 | $15,190 | $5,390 | $9,800 |
| 2018 | $604 | $15,190 | $5,390 | $9,800 |
| 2017 | $579 | $15,190 | $5,390 | $9,800 |
| 2016 | $406 | $10,520 | $5,390 | $5,130 |
| 2015 | $409 | $10,520 | $5,390 | $5,130 |
| 2013 | $399 | $10,300 | $5,390 | $4,910 |
| 2012 | $405 | $10,300 | $5,390 | $4,910 |
Source: Public Records
Map
Nearby Homes