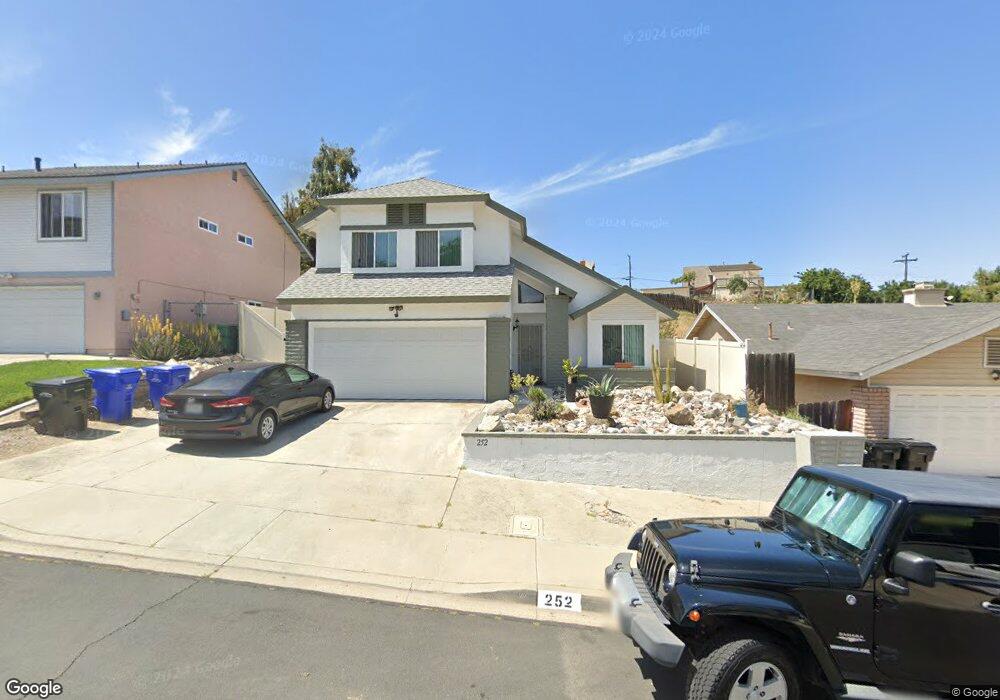
252 Winewood St San Diego, CA 92114
Skyline NeighborhoodEstimated Value: $699,000 - $800,000
3
Beds
3
Baths
1,541
Sq Ft
$496/Sq Ft
Est. Value
About This Home
This home is located at 252 Winewood St, San Diego, CA 92114 and is currently estimated at $764,155, approximately $495 per square foot. 252 Winewood St is a home located in San Diego County with nearby schools including Fulton UTK-8, Bell Middle School, and Morse High School.
Ownership History
Date
Name
Owned For
Owner Type
Purchase Details
Closed on
Feb 22, 2008
Sold by
Residential Funding Co Llc
Bought by
Bew Jason and Bew Monique
Current Estimated Value
Home Financials for this Owner
Home Financials are based on the most recent Mortgage that was taken out on this home.
Original Mortgage
$280,250
Outstanding Balance
$173,887
Interest Rate
5.75%
Mortgage Type
New Conventional
Estimated Equity
$590,268
Purchase Details
Closed on
Nov 16, 2007
Sold by
Nguyen Ho Thanh
Bought by
Residential Funding Co Llc
Purchase Details
Closed on
Sep 28, 2006
Sold by
Do Thu Thi
Bought by
Nguyen Ho Thanh
Home Financials for this Owner
Home Financials are based on the most recent Mortgage that was taken out on this home.
Original Mortgage
$499,000
Interest Rate
9.82%
Mortgage Type
Balloon
Purchase Details
Closed on
Sep 18, 1990
Purchase Details
Closed on
Mar 24, 1987
Create a Home Valuation Report for This Property
The Home Valuation Report is an in-depth analysis detailing your home's value as well as a comparison with similar homes in the area
Home Values in the Area
Average Home Value in this Area
Purchase History
| Date | Buyer | Sale Price | Title Company |
|---|---|---|---|
| Bew Jason | $295,000 | First American Title Ins Co | |
| Residential Funding Co Llc | $364,500 | First American Title Company | |
| Nguyen Ho Thanh | -- | Investors Title Company | |
| -- | $148,100 | -- | |
| -- | $104,500 | -- |
Source: Public Records
Mortgage History
| Date | Status | Borrower | Loan Amount |
|---|---|---|---|
| Open | Bew Jason | $280,250 | |
| Previous Owner | Nguyen Ho Thanh | $499,000 |
Source: Public Records
Tax History Compared to Growth
Tax History
| Year | Tax Paid | Tax Assessment Tax Assessment Total Assessment is a certain percentage of the fair market value that is determined by local assessors to be the total taxable value of land and additions on the property. | Land | Improvement |
|---|---|---|---|---|
| 2025 | $4,700 | $387,469 | $185,197 | $202,272 |
| 2024 | $4,700 | $379,872 | $181,566 | $198,306 |
| 2023 | $4,596 | $372,424 | $178,006 | $194,418 |
| 2022 | $4,474 | $365,122 | $174,516 | $190,606 |
| 2021 | $4,444 | $357,964 | $171,095 | $186,869 |
| 2020 | $4,390 | $354,294 | $169,341 | $184,953 |
| 2019 | $4,312 | $347,348 | $166,021 | $181,327 |
| 2018 | $4,032 | $340,538 | $162,766 | $177,772 |
| 2017 | $3,937 | $333,862 | $159,575 | $174,287 |
| 2016 | $3,787 | $320,000 | $153,000 | $167,000 |
| 2015 | $3,436 | $290,000 | $139,000 | $151,000 |
| 2014 | $3,096 | $260,000 | $125,000 | $135,000 |
Source: Public Records
Map
Nearby Homes
- 7085 Madrone Ave
- 351 Winewood St
- 7358 Gribble St
- 348 Sychar Rd
- 218 Elvado Way
- 7281 Danawoods Ct
- 7420 Jamacha Rd
- 373 69th St
- 238 69th St
- 111 69th St
- 7023 Lisbon St
- 7263 Aquamarine Rd
- 124 Palawan Way
- 7936 Pala St
- 6386 Madrone Ave
- 249 Meadowbrook Dr
- 7853 Gribble St
- 284 Middlebush Dr
- 7449 Bullock Dr
- 6859 Broadway Unit 1
- 242 Winewood St
- 262 Winewood St
- 232 Winewood St
- 270 Winewood St
- 271 Los Soneto Dr
- 281 Los Soneto Dr
- 278 Winewood St
- 222 Winewood St
- 261 Los Soneto Dr
- 291 Los Soneto Dr
- 286 Winewood St
- 212 Winewood St
- 251 Los Soneto Dr
- 301 Los Soneto Dr
- 202 Winewood St
- 263 Winewood St
- 255 Winewood St
- 247 Winewood St
- 271 Winewood St
- 239 Winewood St