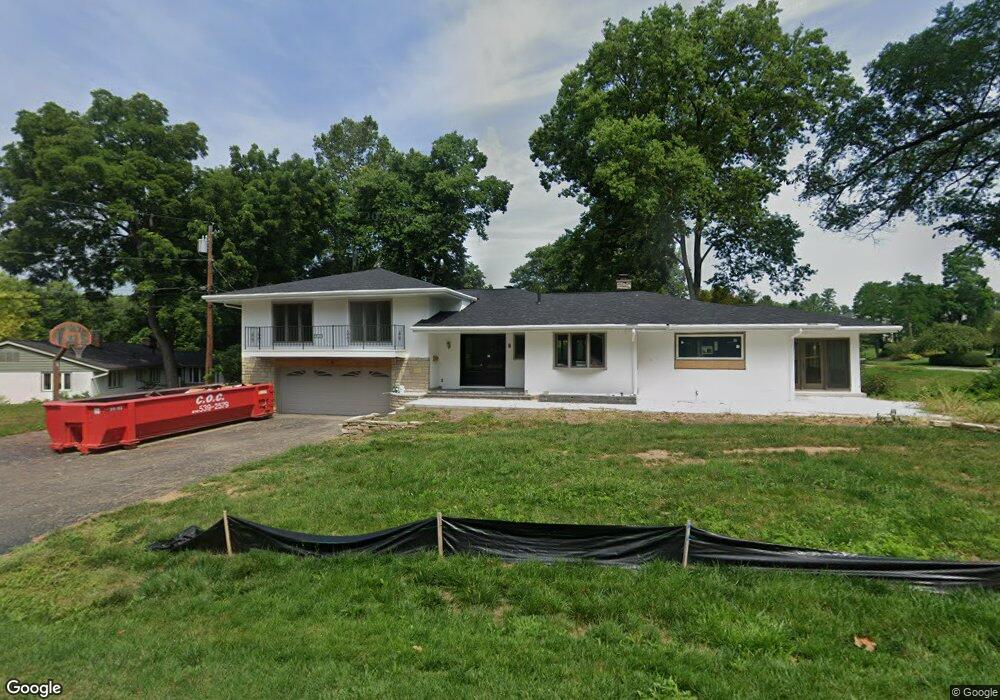
2520 Charing Rd Columbus, OH 43221
Estimated Value: $849,000 - $1,274,000
3
Beds
5
Baths
3,024
Sq Ft
$365/Sq Ft
Est. Value
About This Home
This home is located at 2520 Charing Rd, Columbus, OH 43221 and is currently estimated at $1,102,834, approximately $364 per square foot. 2520 Charing Rd is a home located in Franklin County with nearby schools including Tremont Elementary School, Jones Middle School, and Upper Arlington High School.
Ownership History
Date
Name
Owned For
Owner Type
Purchase Details
Closed on
Aug 22, 2024
Sold by
Ott Bethany Lynn and Ott Julie Ann
Bought by
2520 Charing Rd Llc
Current Estimated Value
Purchase Details
Closed on
Mar 14, 2023
Sold by
Declaration Of Trust
Bought by
Ott Jeffery D
Purchase Details
Closed on
Jan 11, 2001
Sold by
Ott Jeffrey D and Ott Sharon B
Bought by
Ott Sharon B and Trust Of Sharon B Ott
Purchase Details
Closed on
Nov 25, 1987
Bought by
Ott Jeffrey D
Create a Home Valuation Report for This Property
The Home Valuation Report is an in-depth analysis detailing your home's value as well as a comparison with similar homes in the area
Home Values in the Area
Average Home Value in this Area
Purchase History
| Date | Buyer | Sale Price | Title Company |
|---|---|---|---|
| 2520 Charing Rd Llc | $880,000 | Amerititle | |
| Ott Jeffery D | -- | -- | |
| Ott Sharon B | -- | -- | |
| Ott Jeffrey D | $315,000 | -- |
Source: Public Records
Tax History
| Year | Tax Paid | Tax Assessment Tax Assessment Total Assessment is a certain percentage of the fair market value that is determined by local assessors to be the total taxable value of land and additions on the property. | Land | Improvement |
|---|---|---|---|---|
| 2025 | $18,110 | $306,880 | $151,760 | $155,120 |
| 2024 | $18,110 | $306,880 | $151,760 | $155,120 |
| 2023 | $17,546 | $306,880 | $151,760 | $155,120 |
| 2022 | $13,608 | $194,740 | $96,040 | $98,700 |
| 2021 | $12,046 | $194,740 | $96,040 | $98,700 |
| 2020 | $11,403 | $194,740 | $96,040 | $98,700 |
| 2019 | $11,528 | $175,000 | $96,040 | $78,960 |
| 2018 | $11,927 | $175,000 | $96,040 | $78,960 |
| 2017 | $17,557 | $263,900 | $144,830 | $119,070 |
| 2016 | $12,402 | $196,320 | $83,550 | $112,770 |
| 2015 | $12,391 | $196,320 | $83,550 | $112,770 |
| 2014 | $12,405 | $196,320 | $83,550 | $112,770 |
| 2013 | $5,896 | $178,465 | $75,950 | $102,515 |
Source: Public Records
Map
Nearby Homes
- 2245 Riverside Dr Unit 309
- 2827 Katmai Dr
- 2800 Kobuk Dr
- 2808 Kobuk Dr
- 2833 Katmai Dr
- 2835 Katmai Dr
- 2806 Kobuk Dr
- 2841 Katmai Dr
- 2845 Katmai Dr
- 2812 Kobuk Dr
- 2828 Kobuk Dr
- 2828 Kobuk Dr
- 2851 Katmai Dr
- 2853 Katmai Dr
- The Sierra Plan at Quarry Trails - Single Family Homes
- The Aspen Plan at Quarry Trails - Single Family Homes
- The Whitney Plan at Quarry Trails - Single Family Homes
- 2832 Kobuk Dr
- 2872 Kobuk Dr
- 2878 Kobuk Dr
- 2520 Charing Rd
- 2565 Leeds Rd
- 2560 Charing Rd
- 2550 Charing Rd
- 2521 Charing Rd
- 2528 Charing Rd
- 2536 Charing Rd
- 2575 Leeds Rd
- 2540 Leeds Rd
- 2544 Charing Rd
- 2570 Leeds Rd
- 2531 Charing Rd
- 2537 Charing Rd
- 2557 Charing Rd Unit 2557
- 2550 Riverside Dr Unit 2550
- 2551-2555 Charing Rd Unit 5
- 2560 W Lane Ave
- 2565 Charing Rd Unit 5
- 2565 Charing Rd Unit 2
- 2565 Charing Rd
Your Personal Tour Guide
Ask me questions while you tour the home.