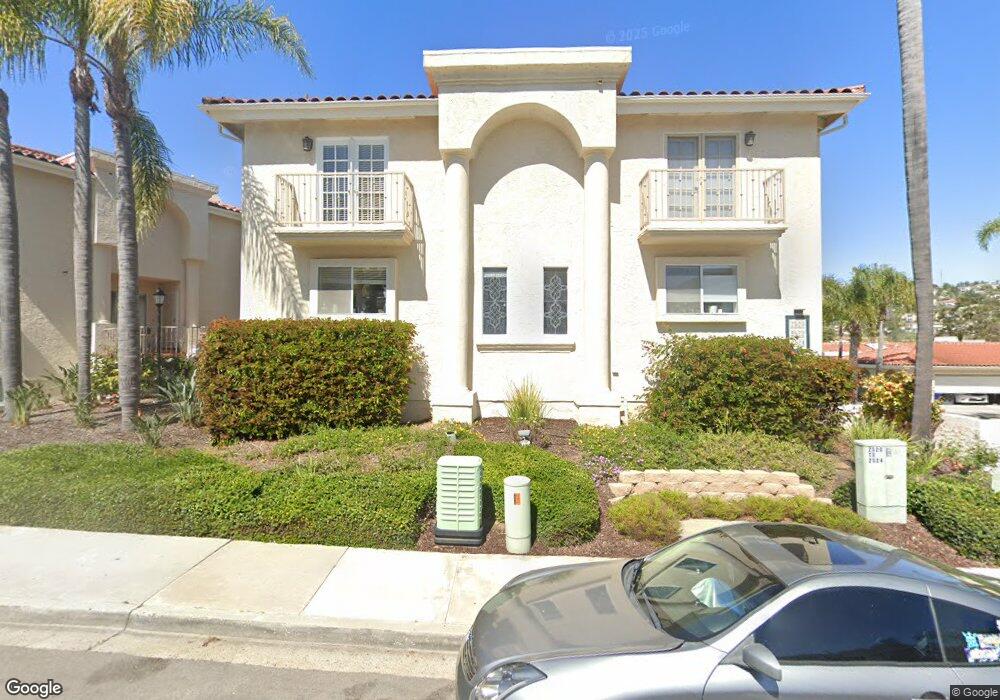
2520 Navarra Dr Unit C Carlsbad, CA 92009
La Costa NeighborhoodEstimated Value: $853,000 - $1,007,000
3
Beds
3
Baths
1,680
Sq Ft
$541/Sq Ft
Est. Value
About This Home
This home is located at 2520 Navarra Dr Unit C, Carlsbad, CA 92009 and is currently estimated at $908,559, approximately $540 per square foot. 2520 Navarra Dr Unit C is a home located in San Diego County with nearby schools including La Costa Heights Elementary School, Oak Crest Middle School, and La Costa Canyon High School.
Ownership History
Date
Name
Owned For
Owner Type
Purchase Details
Closed on
Sep 13, 2021
Sold by
Hopkins Patricia L and Hopkins Patrica
Bought by
Plh Family Trust and Hopkins
Current Estimated Value
Purchase Details
Closed on
Oct 22, 2020
Sold by
Hopkins Susan O
Bought by
Hopkins Patricia
Purchase Details
Closed on
Oct 15, 2018
Sold by
Hopkins Howard L and Hopkins Susan O
Bought by
Hopkins Howard L and Hopkins Susan O
Purchase Details
Closed on
Apr 25, 2002
Sold by
Simmons Steven James and Simmons Susan C
Bought by
Hopkins Howard L and Hopkins Susan O
Purchase Details
Closed on
Jan 9, 2002
Sold by
Tsai Jyh Young
Bought by
Simmons Steven James and Simmons Susan C
Purchase Details
Closed on
Apr 4, 1988
Create a Home Valuation Report for This Property
The Home Valuation Report is an in-depth analysis detailing your home's value as well as a comparison with similar homes in the area
Home Values in the Area
Average Home Value in this Area
Purchase History
| Date | Buyer | Sale Price | Title Company |
|---|---|---|---|
| Plh Family Trust | -- | Mcbride Kristen | |
| Hopkins Patricia | -- | None Available | |
| Hopkins Susan O | -- | None Available | |
| Hopkins Patricia | -- | None Available | |
| Hopkins Howard L | -- | None Available | |
| Hopkins Howard L | $275,000 | Equity Title Company | |
| Simmons Steven James | $275,000 | Equity Title | |
| -- | $190,000 | -- |
Source: Public Records
Tax History Compared to Growth
Tax History
| Year | Tax Paid | Tax Assessment Tax Assessment Total Assessment is a certain percentage of the fair market value that is determined by local assessors to be the total taxable value of land and additions on the property. | Land | Improvement |
|---|---|---|---|---|
| 2025 | $4,701 | $406,243 | $177,268 | $228,975 |
| 2024 | $4,701 | $398,279 | $173,793 | $224,486 |
| 2023 | $4,545 | $390,471 | $170,386 | $220,085 |
| 2022 | $4,422 | $382,816 | $167,046 | $215,770 |
| 2021 | $4,348 | $375,311 | $163,771 | $211,540 |
| 2020 | $4,323 | $371,463 | $162,092 | $209,371 |
| 2019 | $4,241 | $364,180 | $158,914 | $205,266 |
| 2018 | $4,164 | $357,041 | $155,799 | $201,242 |
| 2017 | $4,095 | $350,042 | $152,745 | $197,297 |
| 2016 | $3,974 | $343,179 | $149,750 | $193,429 |
| 2015 | $3,892 | $338,025 | $147,501 | $190,524 |
| 2014 | $3,795 | $331,404 | $144,612 | $186,792 |
Source: Public Records
Map
Nearby Homes
- 2508 Navarra Dr Unit 424
- 2506 Navarra Dr Unit 618
- 2533 Navarra Dr Unit 2A
- 2537 Navarra Dr Unit B9
- 2507 Navarra Dr Unit 202
- 7500 Viejo Castilla Way Unit 9
- 2552 Navarra Dr Unit A
- 2630 Pirineos Way Unit 4
- 2630 Pirineos Way Unit 14
- 2639 Pirineos Way Unit 231
- 2606 Galicia Way
- 7508 Jerez Ct
- 2916 Avenida Valera
- 7394 Altiva Place
- 2433 La Costa Ave Unit A
- 2348 La Costa Ave Unit 202
- 2402 Altisma Way Unit G
- 2412 Altisma Way Unit D
- 2388 Altisma Way Unit 10
- 2349 Altisma Way Unit B
- 2520 Navarra Dr Unit A
- 2520 Navarra Dr Unit A
- 2520 Navarra Dr Unit F
- 2520 Navarra Dr Unit E
- 2520 Navarra Dr Unit D
- 2520 Navarra Dr Unit B
- 2528 Navarra Dr Unit D
- 2528 Navarra Dr Unit C
- 2528 Navarra Dr Unit B
- 2528 Navarra Dr Unit A
- 2524 Navarra Dr
- 2524 Navarra Dr Unit A
- 2524 Navarra Dr Unit B
- 2530 Navarra Dr Unit A
- 2530 Navarra Dr Unit B
- 2522 Navarra Dr Unit A
- 2522 Navarra Dr Unit B
- 2532 Navarra Dr Unit B
- 2523 Navarra #103 Dr
- 2534 Navarra Dr