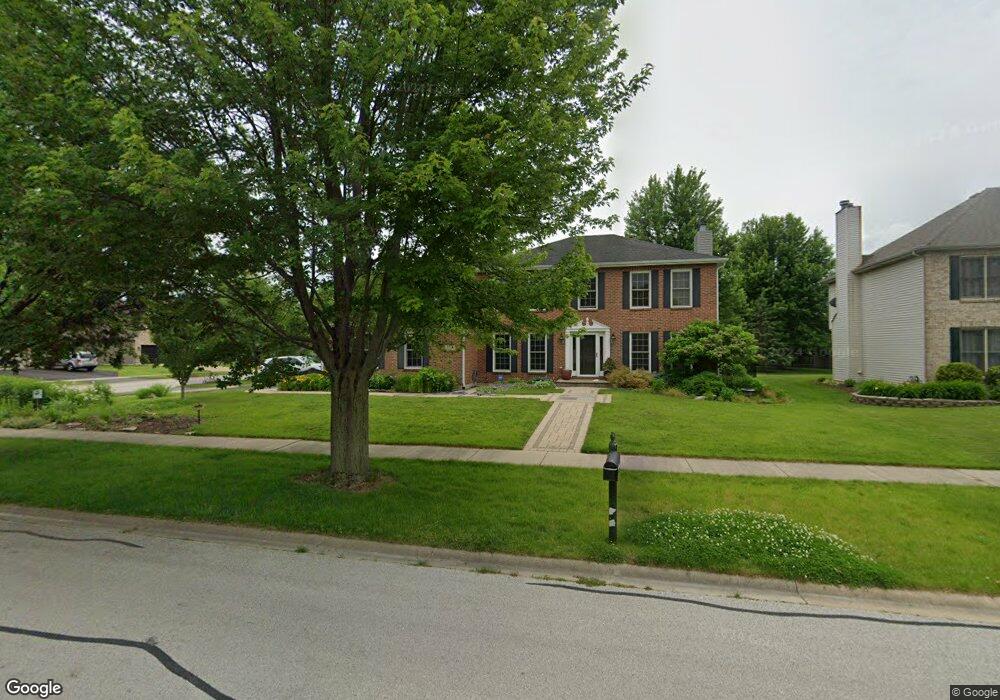
2520 Salt Meadow Rd Naperville, IL 60564
High Meadow NeighborhoodEstimated Value: $639,004 - $754,000
--
Bed
1
Bath
2,173
Sq Ft
$327/Sq Ft
Est. Value
About This Home
This home is located at 2520 Salt Meadow Rd, Naperville, IL 60564 and is currently estimated at $710,001, approximately $326 per square foot. 2520 Salt Meadow Rd is a home located in Will County with nearby schools including Graham Elementary School, Ellsworth Elementary School, and Clifford Crone Middle School.
Ownership History
Date
Name
Owned For
Owner Type
Purchase Details
Closed on
Nov 11, 1997
Sold by
Lindsay Mark A and Lindsay Rebecca A
Bought by
Knight Patrick J and Knight Janet K
Current Estimated Value
Home Financials for this Owner
Home Financials are based on the most recent Mortgage that was taken out on this home.
Original Mortgage
$214,600
Outstanding Balance
$35,749
Interest Rate
7.45%
Estimated Equity
$674,252
Purchase Details
Closed on
May 6, 1996
Sold by
Claybridge Builders Inc
Bought by
Lindsay Mark A and Lindsay Rebecca A
Home Financials for this Owner
Home Financials are based on the most recent Mortgage that was taken out on this home.
Original Mortgage
$32,000
Interest Rate
7.78%
Purchase Details
Closed on
Oct 23, 1995
Sold by
Harris Bank Naperville
Bought by
Claybridge Builders Inc
Home Financials for this Owner
Home Financials are based on the most recent Mortgage that was taken out on this home.
Original Mortgage
$168,700
Interest Rate
7.61%
Create a Home Valuation Report for This Property
The Home Valuation Report is an in-depth analysis detailing your home's value as well as a comparison with similar homes in the area
Home Values in the Area
Average Home Value in this Area
Purchase History
| Date | Buyer | Sale Price | Title Company |
|---|---|---|---|
| Knight Patrick J | $245,000 | -- | |
| Lindsay Mark A | $232,000 | -- | |
| Claybridge Builders Inc | $60,000 | -- |
Source: Public Records
Mortgage History
| Date | Status | Borrower | Loan Amount |
|---|---|---|---|
| Open | Knight Patrick J | $214,600 | |
| Previous Owner | Lindsay Mark A | $32,000 | |
| Previous Owner | Claybridge Builders Inc | $168,700 |
Source: Public Records
Tax History Compared to Growth
Tax History
| Year | Tax Paid | Tax Assessment Tax Assessment Total Assessment is a certain percentage of the fair market value that is determined by local assessors to be the total taxable value of land and additions on the property. | Land | Improvement |
|---|---|---|---|---|
| 2024 | $11,079 | $177,144 | $52,673 | $124,471 |
| 2023 | $11,079 | $156,488 | $46,531 | $109,957 |
| 2022 | $10,292 | $148,055 | $44,017 | $104,038 |
| 2021 | $9,834 | $141,005 | $41,921 | $99,084 |
| 2020 | $9,646 | $138,771 | $41,257 | $97,514 |
| 2019 | $9,479 | $134,860 | $40,094 | $94,766 |
| 2018 | $9,459 | $132,277 | $39,212 | $93,065 |
| 2017 | $9,313 | $128,862 | $38,200 | $90,662 |
| 2016 | $9,294 | $126,088 | $37,378 | $88,710 |
| 2015 | $8,923 | $121,238 | $35,940 | $85,298 |
| 2014 | $8,923 | $112,702 | $30,060 | $82,642 |
| 2013 | $8,923 | $112,702 | $30,060 | $82,642 |
Source: Public Records
Map
Nearby Homes
- 2543 Mallet Ct
- 2539 Mallet Ct
- 2547 Mallet Ct
- 2519 Mallet Ct
- 26106 W Sherwood Cir
- 23234 W Allagash Dr
- 2419 Lawlor Ln
- 2515 Mallet Ct
- 2423 Lawlor Ln
- 2427 Lawlor Ln
- 24024 W Champion Dr
- 2607 Lawlor Ln
- 2611 Lawlor Ln
- 2547 Tailshot Rd
- 2668 Lawlor Ln
- 2711 Wait Rd
- 5907 Polo St
- 5919 Polo St
- 5911 Polo St
- 5943 Polo St
- 2524 Salt Meadow Rd
- 2604 Salt Meadow Rd
- 5212 Chokeberry Dr
- 5311 Catclaw Ct Unit 8
- 5304 Catclaw Ct Unit 8
- 5308 Catclaw Ct
- 2515 Salt Meadow Rd Unit 8
- 5312 Catclaw Ct
- 5308 Velvet Bent Ct
- 2608 Salt Meadow Rd
- 2603 Saltmeadow Rd
- 5315 Catclaw Ct
- 2511 Salt Meadow Rd
- 5208 Chokeberry Dr
- 2603 Salt Meadow Rd Unit 8
- 5304 Velvet Bent Ct
- 5316 Catclaw Ct
- 2612 Saltmeadow Rd
- 2612 Salt Meadow Rd
- 2507 Salt Meadow Rd