--
Bed
--
Bath
3,000
Sq Ft
3,485
Sq Ft Lot
About This Home
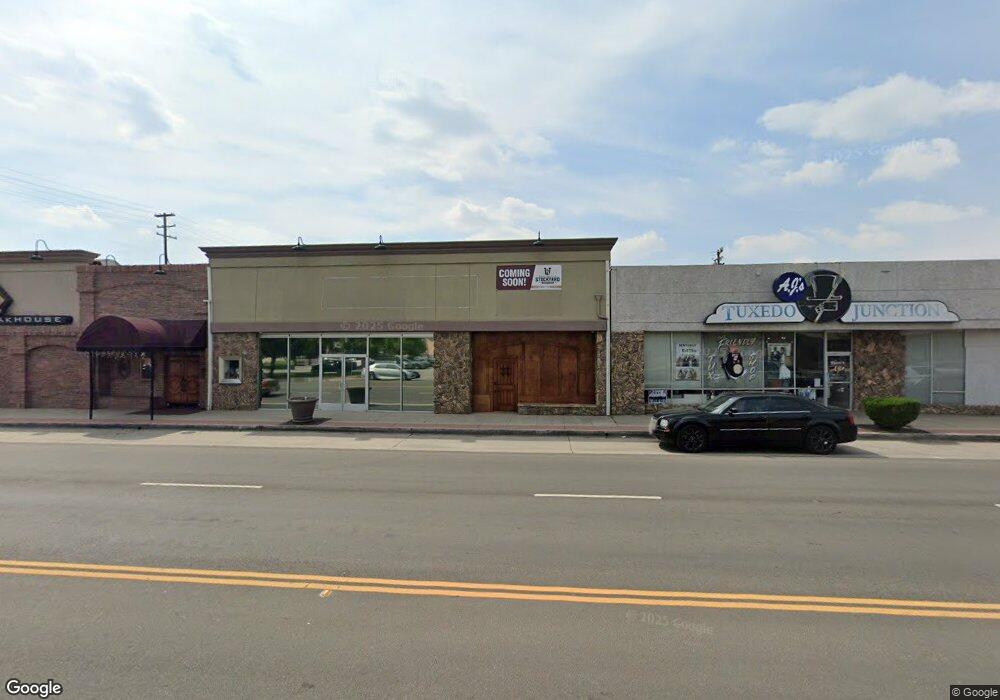
This home is located at 2521 F St, Bakersfield, CA 93301. 2521 F St is a home located in Kern County with nearby schools including Franklin Elementary School, Emerson Middle School, and Bakersfield High School.
Ownership History
Date
Name
Owned For
Owner Type
Purchase Details
Closed on
Nov 20, 2017
Sold by
Kcs Real Property Llc
Bought by
Steak Street Properties Llc
Home Financials for this Owner
Home Financials are based on the most recent Mortgage that was taken out on this home.
Original Mortgage
$1,000,000
Outstanding Balance
$838,616
Interest Rate
3.88%
Mortgage Type
Purchase Money Mortgage
Purchase Details
Closed on
May 10, 2013
Sold by
Soria Francisco and Soria Christina
Bought by
Seemore Properties Llc
Purchase Details
Closed on
Aug 1, 2005
Sold by
Ponder Mark
Bought by
Soria Francisco and Soria Christina
Home Financials for this Owner
Home Financials are based on the most recent Mortgage that was taken out on this home.
Original Mortgage
$205,000
Interest Rate
5.61%
Mortgage Type
Commercial
Purchase Details
Closed on
Oct 8, 2004
Sold by
Jackson Larry A
Bought by
Ponder Mark Lyn
Create a Home Valuation Report for This Property
The Home Valuation Report is an in-depth analysis detailing your home's value as well as a comparison with similar homes in the area
Home Values in the Area
Average Home Value in this Area
Purchase History
| Date | Buyer | Sale Price | Title Company |
|---|---|---|---|
| Steak Street Properties Llc | $1,100,000 | Ticor Title Company | |
| Seemore Properties Llc | $225,000 | Chicago Title Company | |
| Soria Francisco | $340,000 | Chicago Title | |
| Ponder Mark Lyn | $123,000 | Chicago Title |
Source: Public Records
Mortgage History
| Date | Status | Borrower | Loan Amount |
|---|---|---|---|
| Open | Steak Street Properties Llc | $1,000,000 | |
| Previous Owner | Soria Francisco | $205,000 |
Source: Public Records
Tax History Compared to Growth
Tax History
| Year | Tax Paid | Tax Assessment Tax Assessment Total Assessment is a certain percentage of the fair market value that is determined by local assessors to be the total taxable value of land and additions on the property. | Land | Improvement |
|---|---|---|---|---|
| 2025 | $4,704 | $386,856 | $68,267 | $318,589 |
| 2024 | $4,620 | $379,272 | $66,929 | $312,343 |
| 2023 | $4,620 | $371,836 | $65,617 | $306,219 |
| 2022 | $4,549 | $364,546 | $64,331 | $300,215 |
| 2021 | $4,606 | $357,399 | $63,070 | $294,329 |
| 2020 | $4,598 | $353,736 | $62,424 | $291,312 |
| 2019 | $4,512 | $353,736 | $62,424 | $291,312 |
| 2018 | $4,406 | $340,000 | $60,000 | $280,000 |
| 2017 | $3,238 | $238,730 | $60,477 | $178,253 |
| 2016 | $2,941 | $234,050 | $59,292 | $174,758 |
| 2015 | $2,931 | $230,535 | $58,402 | $172,133 |
| 2014 | $2,836 | $226,020 | $57,258 | $168,762 |
Source: Public Records
Map
Nearby Homes