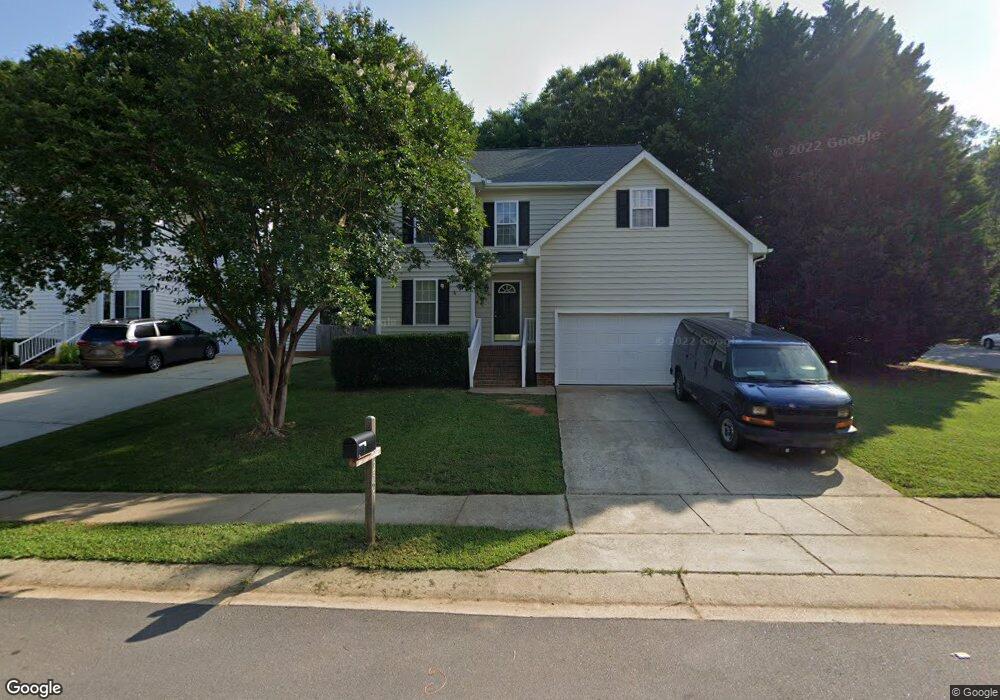
2521 Farlow Gap Ln Raleigh, NC 27603
South Raleigh NeighborhoodEstimated Value: $401,000 - $417,000
3
Beds
3
Baths
1,504
Sq Ft
$271/Sq Ft
Est. Value
About This Home
This home is located at 2521 Farlow Gap Ln, Raleigh, NC 27603 and is currently estimated at $407,657, approximately $271 per square foot. 2521 Farlow Gap Ln is a home located in Wake County with nearby schools including Dillard Drive Magnet Elementary School, Dillard Drive Magnet Middle School, and Longleaf School Of The Arts.
Ownership History
Date
Name
Owned For
Owner Type
Purchase Details
Closed on
Jun 22, 2023
Sold by
Matthews Joseph N and Matthews Margaret
Bought by
Matthews Joseph N
Current Estimated Value
Home Financials for this Owner
Home Financials are based on the most recent Mortgage that was taken out on this home.
Original Mortgage
$228,000
Outstanding Balance
$221,859
Interest Rate
6.35%
Mortgage Type
New Conventional
Estimated Equity
$185,798
Purchase Details
Closed on
May 30, 2006
Sold by
Vick John C and Vick Virginia E
Bought by
Matthews Joseph N
Home Financials for this Owner
Home Financials are based on the most recent Mortgage that was taken out on this home.
Original Mortgage
$26,240
Interest Rate
6.12%
Mortgage Type
Unknown
Purchase Details
Closed on
Nov 6, 1999
Sold by
Murdock & Gannon Construction Inc
Bought by
Vick John U and Vick John Christopher
Home Financials for this Owner
Home Financials are based on the most recent Mortgage that was taken out on this home.
Original Mortgage
$111,050
Interest Rate
6.75%
Create a Home Valuation Report for This Property
The Home Valuation Report is an in-depth analysis detailing your home's value as well as a comparison with similar homes in the area
Home Values in the Area
Average Home Value in this Area
Purchase History
| Date | Buyer | Sale Price | Title Company |
|---|---|---|---|
| Matthews Joseph N | -- | None Listed On Document | |
| Matthews Joseph N | $175,000 | None Available | |
| Vick John U | $139,000 | -- |
Source: Public Records
Mortgage History
| Date | Status | Borrower | Loan Amount |
|---|---|---|---|
| Open | Matthews Joseph N | $228,000 | |
| Previous Owner | Matthews Joseph N | $26,240 | |
| Previous Owner | Matthews Joseph N | $139,960 | |
| Previous Owner | Vick John U | $111,050 |
Source: Public Records
Tax History Compared to Growth
Tax History
| Year | Tax Paid | Tax Assessment Tax Assessment Total Assessment is a certain percentage of the fair market value that is determined by local assessors to be the total taxable value of land and additions on the property. | Land | Improvement |
|---|---|---|---|---|
| 2025 | $3,475 | $396,225 | $160,000 | $236,225 |
| 2024 | $3,461 | $396,225 | $160,000 | $236,225 |
| 2023 | $2,817 | $256,564 | $60,000 | $196,564 |
| 2022 | $2,618 | $256,564 | $60,000 | $196,564 |
| 2021 | $2,516 | $256,564 | $60,000 | $196,564 |
| 2020 | $2,471 | $256,564 | $60,000 | $196,564 |
| 2019 | $2,185 | $186,807 | $54,000 | $132,807 |
| 2018 | $2,061 | $186,807 | $54,000 | $132,807 |
| 2017 | $1,963 | $186,807 | $54,000 | $132,807 |
| 2016 | $1,923 | $186,807 | $54,000 | $132,807 |
| 2015 | $1,890 | $180,593 | $48,000 | $132,593 |
| 2014 | $1,793 | $180,593 | $48,000 | $132,593 |
Source: Public Records
Map
Nearby Homes
- 2816 Alder Ridge Ln
- 2901 Alder Ridge Ln
- 2639 Broad Oaks Place Unit 21
- 2607 Sterling Park Dr
- 2505 Ferndown Ct
- 2636 Scattered Oak Ct
- 2528 Beech Gap Ct
- 2221 Mountain Mist Ct Unit 201
- 2271 Trailwood Valley Cir
- 2524 Ferndown Ct
- 3113 Henslowe Dr
- 2621 Ivory Run Way Unit 105
- 1901 Trailwood Heights Ln Unit 304
- 2228 Trailwood Valley Cir
- 2831 Barrymore St Unit 107
- 2108 Leadenhall Way
- 2220 Hoot Owl Ct
- 2920 Barrymore St Unit 106
- 3109 Tryon Rd
- 3113 Tryon Rd
- 2517 Farlow Gap Ln
- 2708 Alder Ridge Ln
- 2601 Farlow Gap Ln
- 2520 Farlow Gap Ln
- 2800 Alder Ridge Ln
- 2704 Alder Ridge Ln
- 2501 Farlow Gap Ln
- 2701 Cassimir Ct
- 2709 Alder Ridge Ln
- 2516 Farlow Gap Ln
- 2804 Alder Ridge Ln
- 2512 Farlow Gap Ln
- 2705 Alder Ridge Ln
- 2600 Farlow Gap Ln
- 2605 Farlow Gap Ln
- 2700 Alder Ridge Ln
- 2700 Cassimir Ct
- 2508 Horizon Hike Ct
- 2508 Farlow Gap Ln
- 2724 Upper Dry Falls Ct