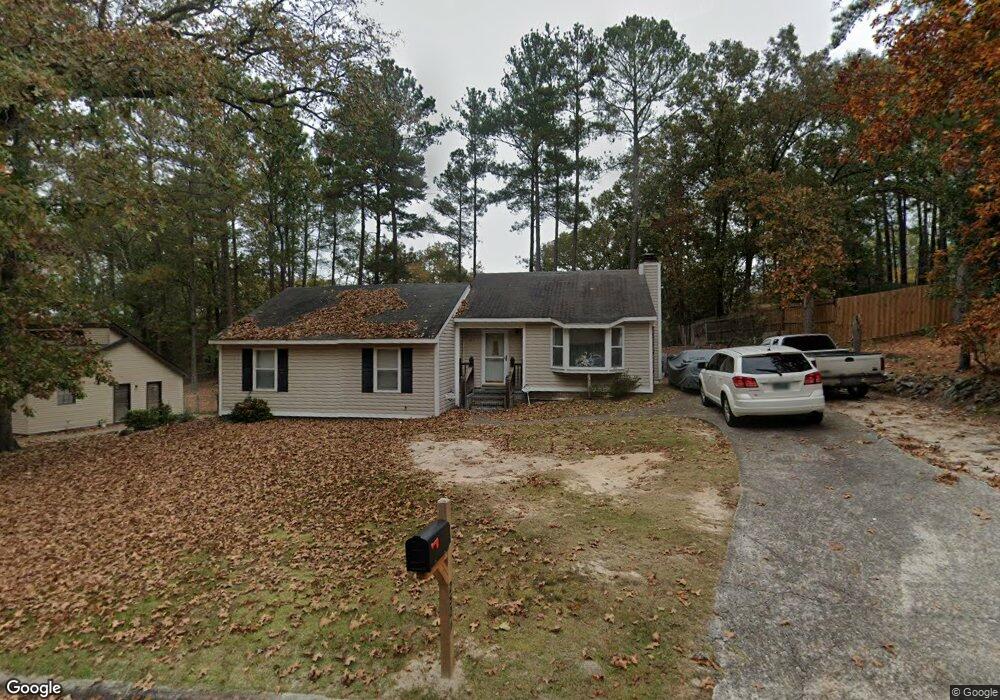
2521 Hanover St Hephzibah, GA 30815
Windsor Spring NeighborhoodEstimated Value: $165,371 - $174,000
3
Beds
2
Baths
1,314
Sq Ft
$130/Sq Ft
Est. Value
About This Home
This home is located at 2521 Hanover St, Hephzibah, GA 30815 and is currently estimated at $171,093, approximately $130 per square foot. 2521 Hanover St is a home located in Richmond County with nearby schools including Jamestown Elementary School, Glenn Hills Middle School, and Johnson Magnet.
Ownership History
Date
Name
Owned For
Owner Type
Purchase Details
Closed on
Dec 17, 2007
Sold by
Robinson Eric
Bought by
Robinson Constance and Robinson Connie
Current Estimated Value
Home Financials for this Owner
Home Financials are based on the most recent Mortgage that was taken out on this home.
Original Mortgage
$56,000
Interest Rate
6.21%
Mortgage Type
Purchase Money Mortgage
Purchase Details
Closed on
Oct 15, 1990
Sold by
Robinson Eric D
Bought by
Southern Federal Sa
Purchase Details
Closed on
Feb 14, 1990
Sold by
First Union Mortgage Corp Cameron-Brown
Bought by
Housing & Urban Development Secretary Of
Purchase Details
Closed on
Oct 27, 1986
Sold by
Titus Charles E By Atty Thompson Alvin K
Bought by
Turner Isaac S
Purchase Details
Closed on
Sep 1, 1986
Sold by
Titus Charles E By
Bought by
Turner Isaac S
Create a Home Valuation Report for This Property
The Home Valuation Report is an in-depth analysis detailing your home's value as well as a comparison with similar homes in the area
Home Values in the Area
Average Home Value in this Area
Purchase History
| Date | Buyer | Sale Price | Title Company |
|---|---|---|---|
| Robinson Constance | -- | None Available | |
| Southern Federal Sa | $42,400 | -- | |
| Robinson Eric Robinson Connie | -- | -- | |
| Housing & Urban Development Secretary Of | -- | -- | |
| Turner Isaac S | $51,500 | -- | |
| Turner Isaac S | $51,500 | -- |
Source: Public Records
Mortgage History
| Date | Status | Borrower | Loan Amount |
|---|---|---|---|
| Closed | Robinson Constance | $56,000 |
Source: Public Records
Tax History Compared to Growth
Tax History
| Year | Tax Paid | Tax Assessment Tax Assessment Total Assessment is a certain percentage of the fair market value that is determined by local assessors to be the total taxable value of land and additions on the property. | Land | Improvement |
|---|---|---|---|---|
| 2025 | $2,051 | $63,828 | $6,480 | $57,348 |
| 2024 | $2,051 | $59,884 | $6,480 | $53,404 |
| 2023 | $1,040 | $56,748 | $6,480 | $50,268 |
| 2022 | $1,301 | $37,346 | $6,480 | $30,866 |
| 2021 | $1,047 | $26,212 | $6,480 | $19,732 |
| 2020 | $1,035 | $26,212 | $6,480 | $19,732 |
| 2019 | $1,082 | $26,212 | $6,480 | $19,732 |
| 2018 | $1,088 | $26,212 | $6,480 | $19,732 |
| 2017 | $1,065 | $26,212 | $6,480 | $19,732 |
| 2016 | $1,065 | $26,212 | $6,480 | $19,732 |
| 2015 | $1,071 | $26,212 | $6,480 | $19,732 |
| 2014 | $1,065 | $25,985 | $6,480 | $19,505 |
Source: Public Records
Map
Nearby Homes
- 2509 Drumcliff Ct
- 2503 Dewsbury Ct
- 3583 Woodlake Rd
- 3504 Snowden Dr
- 3526 Edmonton St
- 3609 Fairfax Ct
- 2669 Corning St
- 2726 Cardigan Ct
- 2527 Meadowbrook Dr
- 3630 Windsor Spring Road Rd
- 3606 Monmouth Rd
- 3522 Bullock Ave
- 2219 Archer Ln
- 2217 Archer Ln
- 2238 Archer Ln
- 2215 Archer Ln
- 2242 Archer Ln
- 2259 Archer Ln
- 3552 Gardenbrook Dr
- 2523 Hanover St
- 2519 Hanover St
- 2504 S Whitechurch Ct
- 2525 Hanover St
- 2526 Hanover St
- 2502 S Whitechurch Ct
- 2517 Hanover St
- 2524 Hanover St
- 2528 Hanover St
- 2506 S Whitechurch Ct
- 3501 Hemstead Ct
- 2527 Hanover St
- 2501 S Whitechurch Ct
- 2515 Hanover St
- 2501 S White Church Ct
- 2501 S Whitechurch Ct
- 2511 Drumcliff Ct
- 3503 Hemstead Ct
- 2530 Hanover St