Estimated Value: $512,000 - $706,000
4
Beds
3
Baths
1,650
Sq Ft
$392/Sq Ft
Est. Value
About This Home
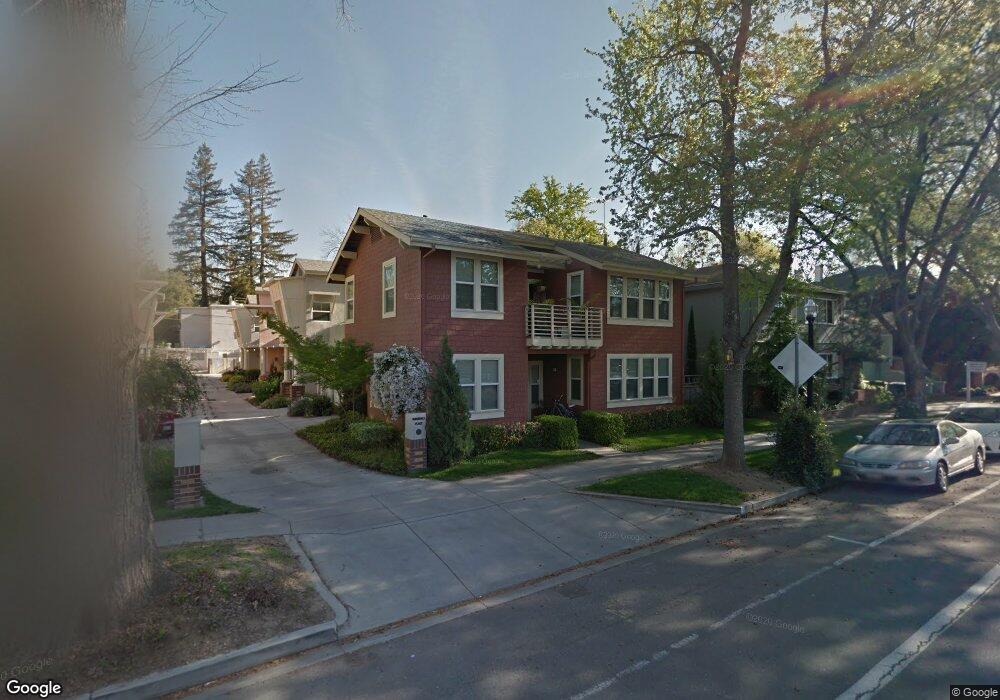
This home is located at 2521 I St, Sacramento, CA 95816 and is currently estimated at $646,321, approximately $391 per square foot. 2521 I St is a home located in Sacramento County with nearby schools including Theodore Judah Elementary, Miwok Middle School, and C. K. McClatchy High.
Ownership History
Date
Name
Owned For
Owner Type
Purchase Details
Closed on
May 16, 2019
Sold by
Reed Hayes and Reed Jenica
Bought by
The Reed Living Trust
Current Estimated Value
Purchase Details
Closed on
Aug 11, 2012
Sold by
Reed Hayes
Bought by
Huddleston Reed Hayes and Huddleston Reed Jenica
Home Financials for this Owner
Home Financials are based on the most recent Mortgage that was taken out on this home.
Original Mortgage
$191,500
Outstanding Balance
$81,857
Interest Rate
3.52%
Mortgage Type
New Conventional
Estimated Equity
$564,464
Purchase Details
Closed on
Sep 10, 2003
Sold by
2515 I Street Development Co Llc
Bought by
Reed Hayes
Home Financials for this Owner
Home Financials are based on the most recent Mortgage that was taken out on this home.
Original Mortgage
$196,500
Interest Rate
6.06%
Mortgage Type
Purchase Money Mortgage
Create a Home Valuation Report for This Property
The Home Valuation Report is an in-depth analysis detailing your home's value as well as a comparison with similar homes in the area
Home Values in the Area
Average Home Value in this Area
Purchase History
| Date | Buyer | Sale Price | Title Company |
|---|---|---|---|
| The Reed Living Trust | -- | None Available | |
| Huddleston Reed Hayes | -- | Servicelink | |
| Reed Hayes | $370,500 | Stewart Title |
Source: Public Records
Mortgage History
| Date | Status | Borrower | Loan Amount |
|---|---|---|---|
| Open | Huddleston Reed Hayes | $191,500 | |
| Closed | Reed Hayes | $196,500 |
Source: Public Records
Tax History Compared to Growth
Tax History
| Year | Tax Paid | Tax Assessment Tax Assessment Total Assessment is a certain percentage of the fair market value that is determined by local assessors to be the total taxable value of land and additions on the property. | Land | Improvement |
|---|---|---|---|---|
| 2025 | $6,234 | $526,323 | $177,715 | $348,608 |
| 2024 | $6,234 | $516,004 | $174,231 | $341,773 |
| 2023 | $6,088 | $505,887 | $170,815 | $335,072 |
| 2022 | $5,986 | $495,968 | $167,466 | $328,502 |
| 2021 | $5,703 | $486,244 | $164,183 | $322,061 |
| 2020 | $5,751 | $481,259 | $162,500 | $318,759 |
| 2019 | $5,629 | $471,823 | $159,314 | $312,509 |
| 2018 | $5,483 | $462,573 | $156,191 | $306,382 |
| 2017 | $5,409 | $453,504 | $153,129 | $300,375 |
| 2016 | $5,221 | $444,613 | $150,127 | $294,486 |
| 2015 | $5,144 | $437,935 | $147,872 | $290,063 |
| 2014 | $5,004 | $429,358 | $144,976 | $284,382 |
Source: Public Records
Map
Nearby Homes