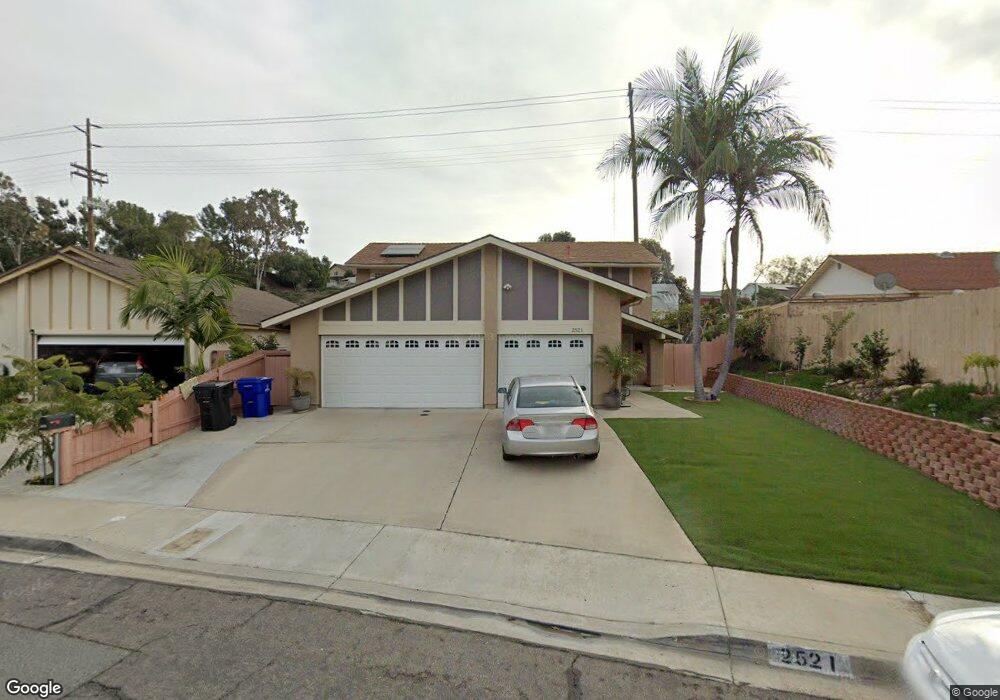
2521 Perkon Ct San Diego, CA 92105
Ridgeview-Webster NeighborhoodEstimated Value: $790,000 - $910,000
4
Beds
2
Baths
1,940
Sq Ft
$435/Sq Ft
Est. Value
About This Home
This home is located at 2521 Perkon Ct, San Diego, CA 92105 and is currently estimated at $843,838, approximately $434 per square foot. 2521 Perkon Ct is a home located in San Diego County with nearby schools including Oak Park Elementary School, Mann Middle School, and Crawford High School.
Ownership History
Date
Name
Owned For
Owner Type
Purchase Details
Closed on
Jul 21, 2025
Sold by
Trang Thong
Bought by
Thong Trang Trust and Trang
Current Estimated Value
Purchase Details
Closed on
Sep 23, 2024
Sold by
Chau Thao Thi
Bought by
Jc Irrevocable Trust and Chau
Purchase Details
Closed on
Jun 12, 2012
Sold by
Trang Thong and Trang Thao Thi
Bought by
Trang Thong and Trang Thao Thi
Purchase Details
Closed on
Aug 17, 2000
Sold by
Swns Nguyen Do P and Jacqueline Nguyen
Bought by
Trang Thong and Trang Thao Thi
Home Financials for this Owner
Home Financials are based on the most recent Mortgage that was taken out on this home.
Original Mortgage
$130,980
Interest Rate
7.93%
Purchase Details
Closed on
Jan 30, 1998
Sold by
Nguyen Do P and Chris Lam
Bought by
Nguyen Do P and Nguyen Jacqueline
Purchase Details
Closed on
Aug 9, 1984
Create a Home Valuation Report for This Property
The Home Valuation Report is an in-depth analysis detailing your home's value as well as a comparison with similar homes in the area
Home Values in the Area
Average Home Value in this Area
Purchase History
| Date | Buyer | Sale Price | Title Company |
|---|---|---|---|
| Thong Trang Trust | -- | None Listed On Document | |
| Jc Irrevocable Trust | -- | None Listed On Document | |
| Trang Thong | -- | None Listed On Document | |
| Trang Thong | -- | None Available | |
| Trang Thong | $201,500 | South Coast Title Company | |
| Nguyen Do P | -- | -- | |
| -- | $92,200 | -- |
Source: Public Records
Mortgage History
| Date | Status | Borrower | Loan Amount |
|---|---|---|---|
| Previous Owner | Trang Thong | $130,980 |
Source: Public Records
Tax History Compared to Growth
Tax History
| Year | Tax Paid | Tax Assessment Tax Assessment Total Assessment is a certain percentage of the fair market value that is determined by local assessors to be the total taxable value of land and additions on the property. | Land | Improvement |
|---|---|---|---|---|
| 2025 | $3,605 | $303,606 | $90,399 | $213,207 |
| 2024 | $3,605 | $297,654 | $88,627 | $209,027 |
| 2023 | $3,523 | $291,819 | $86,890 | $204,929 |
| 2022 | $3,428 | $286,098 | $85,187 | $200,911 |
| 2021 | $3,403 | $280,489 | $83,517 | $196,972 |
| 2020 | $3,361 | $277,614 | $82,661 | $194,953 |
| 2019 | $3,300 | $272,172 | $81,041 | $191,131 |
| 2018 | $3,084 | $266,836 | $79,452 | $187,384 |
| 2017 | $80 | $261,605 | $77,895 | $183,710 |
| 2016 | $2,959 | $256,476 | $76,368 | $180,108 |
| 2015 | $2,915 | $252,624 | $75,221 | $177,403 |
| 2014 | $2,868 | $247,676 | $73,748 | $173,928 |
Source: Public Records
Map
Nearby Homes
- 4918 Dalehaven Place
- 5233 Caminito Cachorro
- 0 Redwood St Unit IG25200939
- 2501 2503 Sumac Dr
- 4666 Home Ave Unit 68
- 1951 47th St Unit 69
- 1951 47th St Unit 118
- 1951 47th St Unit Spc 86
- 1951 47th St Unit SPC 44
- 1951 47th St Unit 100
- 2877 47th St
- 2215 Susan Place
- 4927 Deaton Dr
- 4712 Home Ave
- 1828 Oakshire Ct
- 2541 Roseview Place
- 3015 Chamoune Ave
- 2151 54th St
- 3124 Menlo Ave
- 4769 Thorn St
- 2531 Perkon Ct
- 4996 Perkon Place
- 4986 Perkon Place
- 2541 Perkon Ct
- 2520 Perkon Ct
- 5010 Laurel St
- 2530 Perkon Ct
- 4966 Perkon Place
- 2551 Perkon Ct
- 4956 Perkon Place
- 2540 Perkon Ct
- 4981 Perkon Place
- 4997 Perkon Place
- 2561 Perkon Ct
- 2571 Perkon Ct
- 5030 Laurel St
- 4973 Perkon Place
- 2550 Perkon Ct
- 4946 Perkon Place
- 5005 Laurel St