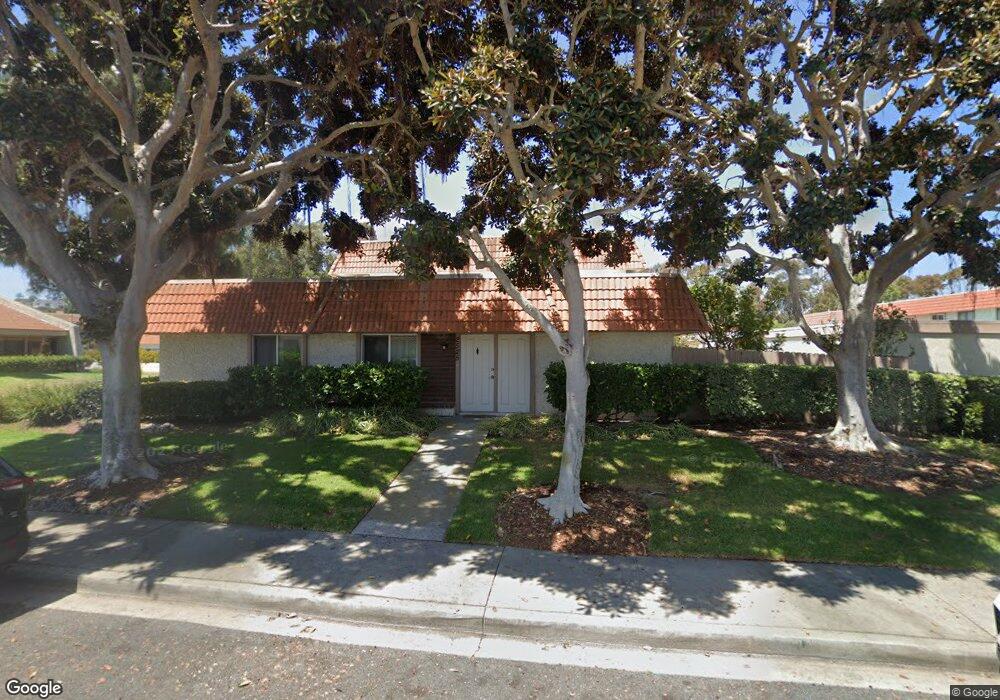
2521 Via Esparto Carlsbad, CA 92010
Tamarack Point NeighborhoodEstimated Value: $766,119 - $876,000
3
Beds
3
Baths
1,452
Sq Ft
$561/Sq Ft
Est. Value
About This Home
This home is located at 2521 Via Esparto, Carlsbad, CA 92010 and is currently estimated at $815,030, approximately $561 per square foot. 2521 Via Esparto is a home located in San Diego County with nearby schools including Buena Vista Elementary, Carlsbad High School, and Sage Creek High.
Ownership History
Date
Name
Owned For
Owner Type
Purchase Details
Closed on
Mar 19, 2002
Sold by
Philburn Robert J
Bought by
Philburn Robert T and Philburn Asa K
Current Estimated Value
Home Financials for this Owner
Home Financials are based on the most recent Mortgage that was taken out on this home.
Original Mortgage
$113,100
Interest Rate
6.78%
Purchase Details
Closed on
Jul 16, 1993
Sold by
Philburn Therese M
Bought by
Philburn Robert J
Home Financials for this Owner
Home Financials are based on the most recent Mortgage that was taken out on this home.
Original Mortgage
$107,120
Interest Rate
7.16%
Mortgage Type
FHA
Purchase Details
Closed on
Jul 8, 1993
Sold by
Martin Douglas K
Bought by
Philburn Robert T and Philburn Robert J
Home Financials for this Owner
Home Financials are based on the most recent Mortgage that was taken out on this home.
Original Mortgage
$107,120
Interest Rate
7.16%
Mortgage Type
FHA
Create a Home Valuation Report for This Property
The Home Valuation Report is an in-depth analysis detailing your home's value as well as a comparison with similar homes in the area
Home Values in the Area
Average Home Value in this Area
Purchase History
| Date | Buyer | Sale Price | Title Company |
|---|---|---|---|
| Philburn Robert T | -- | Chicago Title Co | |
| Philburn Robert J | -- | Orange Coast Title Company | |
| Philburn Robert T | $124,000 | Orange Coast |
Source: Public Records
Mortgage History
| Date | Status | Borrower | Loan Amount |
|---|---|---|---|
| Closed | Philburn Robert T | $113,100 | |
| Closed | Philburn Robert J | $107,120 |
Source: Public Records
Tax History Compared to Growth
Tax History
| Year | Tax Paid | Tax Assessment Tax Assessment Total Assessment is a certain percentage of the fair market value that is determined by local assessors to be the total taxable value of land and additions on the property. | Land | Improvement |
|---|---|---|---|---|
| 2025 | $2,245 | $210,723 | $37,803 | $172,920 |
| 2024 | $2,245 | $206,592 | $37,062 | $169,530 |
| 2023 | $2,233 | $202,542 | $36,336 | $166,206 |
| 2022 | $2,198 | $198,572 | $35,624 | $162,948 |
| 2021 | $2,182 | $194,679 | $34,926 | $159,753 |
| 2020 | $2,167 | $192,683 | $34,568 | $158,115 |
| 2019 | $2,129 | $188,906 | $33,891 | $155,015 |
| 2018 | $2,040 | $185,203 | $33,227 | $151,976 |
| 2017 | $2,006 | $181,573 | $32,576 | $148,997 |
| 2016 | $1,925 | $178,014 | $31,938 | $146,076 |
| 2015 | $1,918 | $175,341 | $31,459 | $143,882 |
| 2014 | $1,887 | $171,907 | $30,843 | $141,064 |
Source: Public Records
Map
Nearby Homes
- 2517 Via Astuto Unit 1
- 2334 Kimberly Ct
- 2360 Hosp Way Unit 331
- 3442 Celinda Dr
- 2336 Hosp Way Unit 314
- 3190 Falcon Dr
- 3354 Seacrest Dr
- 3365 Seacrest Dr
- 3306 Donna Dr
- 2225 David Place
- 2035 Basswood Ave
- 2732 Forest Park Ln
- 2360 Paseo de Laura Unit 2
- 2062 Avenue of The Trees
- 3485 Corvallis St
- 3072 Marron Rd
- 3736 Donna Ct
- 3721 Donna Ct
- 3304 Telaga Rd
- 3245 Valley St
- 2523 Via Esparto
- 2519 Via Esparto
- 2525 Via Esparto Unit 1
- 2517 Via Esparto
- 2515 Via Esparto
- 2520 Via Esparto
- 2522 Via Esparto
- 2513 Via Esparto
- 2524 Via Esparto
- 2518 Via Esparto
- 2516 Via Esparto
- 2514 Via Esparto
- 2511 Via Esparto
- 2512 Via Esparto
- 3102 Via Sorbete
- 2510 Via Esparto Unit 2
- 3104 Via Sorbete
- 2601 Via Vera Unit 2
- 3106 Via Sorbete
- 3035 Via Sabinas