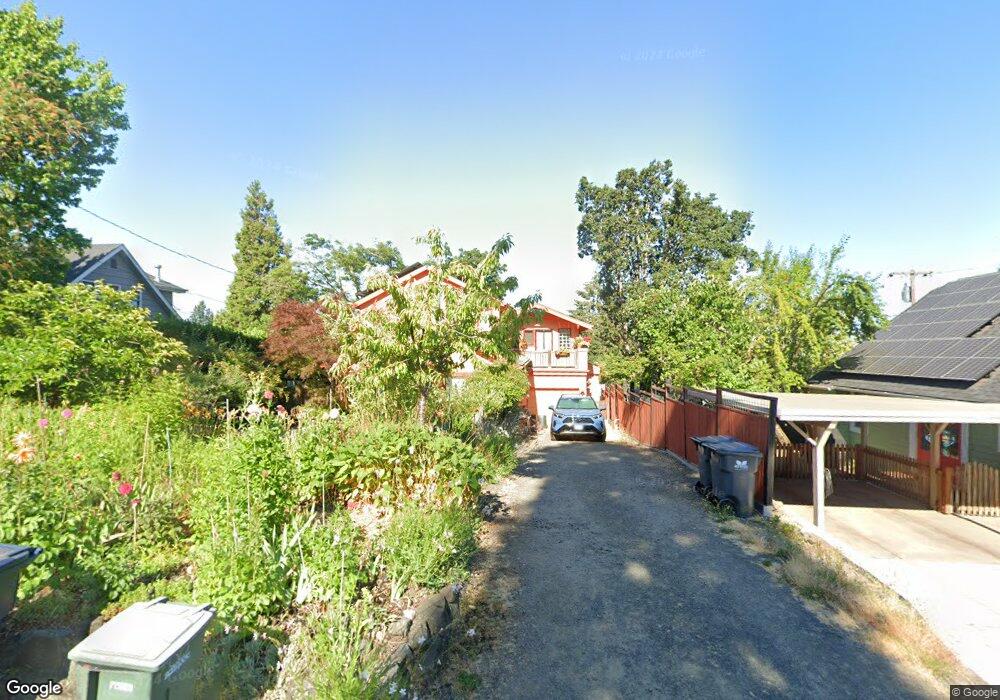
2522 Van Ness St Eugene, OR 97403
Fairmount NeighborhoodEstimated Value: $722,118 - $808,000
4
Beds
2
Baths
2,328
Sq Ft
$329/Sq Ft
Est. Value
About This Home
This home is located at 2522 Van Ness St, Eugene, OR 97403 and is currently estimated at $767,030, approximately $329 per square foot. 2522 Van Ness St is a home located in Lane County with nearby schools including Edison Elementary School, Roosevelt Middle School, and South Eugene High School.
Ownership History
Date
Name
Owned For
Owner Type
Purchase Details
Closed on
Jan 4, 2023
Sold by
Traisman Andrew Martin
Bought by
Andrew Martin Traisman Revocable Living Trust
Current Estimated Value
Purchase Details
Closed on
Aug 20, 2004
Sold by
Adam Lisa M and William Boyers C
Bought by
Traisman Andrew M
Home Financials for this Owner
Home Financials are based on the most recent Mortgage that was taken out on this home.
Original Mortgage
$150,000
Interest Rate
5.95%
Mortgage Type
New Conventional
Purchase Details
Closed on
Jan 13, 1999
Sold by
Dixon Willard C and Dixon Donna Lynn
Bought by
Adam Lisa M and Adam William Boyers
Home Financials for this Owner
Home Financials are based on the most recent Mortgage that was taken out on this home.
Original Mortgage
$147,200
Interest Rate
6.66%
Create a Home Valuation Report for This Property
The Home Valuation Report is an in-depth analysis detailing your home's value as well as a comparison with similar homes in the area
Home Values in the Area
Average Home Value in this Area
Purchase History
| Date | Buyer | Sale Price | Title Company |
|---|---|---|---|
| Andrew Martin Traisman Revocable Living Trust | -- | -- | |
| Traisman Andrew M | $299,000 | Western Title & Escrow Co | |
| Adam Lisa M | $184,000 | Title Guaranty Company |
Source: Public Records
Mortgage History
| Date | Status | Borrower | Loan Amount |
|---|---|---|---|
| Previous Owner | Traisman Andrew M | $150,000 | |
| Previous Owner | Adam Lisa M | $147,200 | |
| Closed | Traisman Andrew M | $119,100 |
Source: Public Records
Tax History
| Year | Tax Paid | Tax Assessment Tax Assessment Total Assessment is a certain percentage of the fair market value that is determined by local assessors to be the total taxable value of land and additions on the property. | Land | Improvement |
|---|---|---|---|---|
| 2025 | $7,791 | $399,881 | -- | -- |
| 2024 | $7,694 | $388,234 | -- | -- |
| 2023 | $7,694 | $376,927 | $0 | $0 |
| 2022 | $7,208 | $365,949 | $0 | $0 |
| 2021 | $6,770 | $355,291 | $0 | $0 |
| 2020 | $6,794 | $344,943 | $0 | $0 |
| 2019 | $6,562 | $334,897 | $0 | $0 |
| 2018 | $6,177 | $315,673 | $0 | $0 |
| 2017 | $5,900 | $315,673 | $0 | $0 |
| 2016 | $5,736 | $306,479 | $0 | $0 |
| 2015 | $5,563 | $297,552 | $0 | $0 |
| 2014 | $5,476 | $288,885 | $0 | $0 |
Source: Public Records
Map
Nearby Homes
- 2642 Central Blvd
- 0 Agate St
- 2683 Cresta de Ruta St
- 2825 2819 Capital Dr Unit 18, 19
- 0 Capital Dr
- 2993 Capital Dr Unit 1
- 2985 Capital Dr Unit 3
- 2694 Cupola Dr Unit 21
- 2620 Cupola Dr Unit 27
- 2693 Cupola Dr
- 2662 Cupola Dr Unit 31
- 2639 Cupola Dr Unit 12
- 2610 Elinor St
- 2627 Cupola Dr Unit 9
- 2629 Cupola Dr Unit 10
- 2042 Onyx St
- 2645 Cupola Dr Unit 13
- 275 Sunset Dr
- 2984 Floral Hill Dr
- 1993 Fircrest Dr
- 1780 E 25th Ave
- 1898 E 25th Ave
- 2538 Van Ness St
- 1770 E 25th Ave
- 2531 Chula Vista Blvd
- 2515 Chula Vista Blvd
- 2551 Chula Vista Blvd
- 1740 E 25th Ave
- 0 SW Fairmount Ave Unit 22343219
- 2561 Chula Vista Blvd
- 2560 Van Ness St
- 2557 Van Ness St
- 2525 Van Ness St
- 2518 Chula Vista Blvd
- 2550 Chula Vista Blvd
- 1789 E 25th Ave
- 2565 Van Ness St
- 1797 E 25th Ave
- 2570 Van Ness St
- 2528 Chula Vista Blvd
Your Personal Tour Guide
Ask me questions while you tour the home.