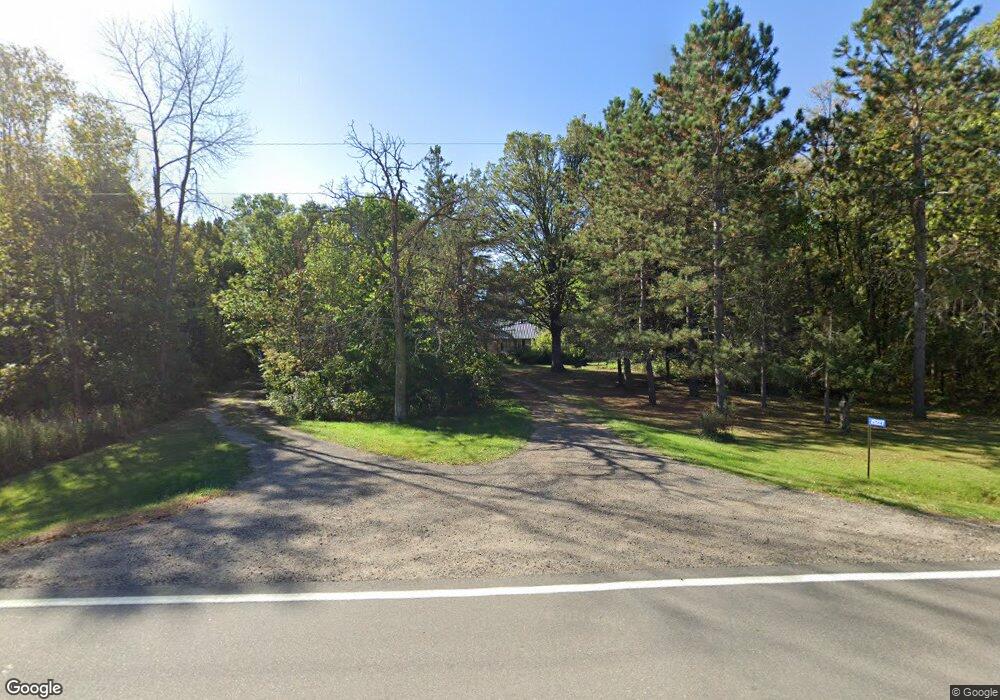
25227 County 16 Laporte, MN 56461
Estimated Value: $160,000 - $259,598
2
Beds
1
Bath
952
Sq Ft
$234/Sq Ft
Est. Value
About This Home
This home is located at 25227 County 16, Laporte, MN 56461 and is currently estimated at $222,650, approximately $233 per square foot. 25227 County 16 is a home located in Hubbard County with nearby schools including Horace May Elementary School, Bemidji Middle School, and Bemidji Senior High School.
Ownership History
Date
Name
Owned For
Owner Type
Purchase Details
Closed on
Dec 18, 2009
Sold by
Affinity Plus Federal Credit Union
Bought by
Johnson Nathan D and Johnson Danae R
Current Estimated Value
Home Financials for this Owner
Home Financials are based on the most recent Mortgage that was taken out on this home.
Original Mortgage
$63,650
Interest Rate
5.02%
Mortgage Type
New Conventional
Purchase Details
Closed on
Nov 19, 2008
Sold by
Ellenson Terry L and Ellenson Leann J
Bought by
Affinity Plus Federal Credit Union
Purchase Details
Closed on
Sep 6, 2006
Sold by
Moe Ivan S and Moe Penny M
Bought by
Ellenson Terry Lee and Ellenson Leeann Joy
Home Financials for this Owner
Home Financials are based on the most recent Mortgage that was taken out on this home.
Original Mortgage
$73,000
Interest Rate
6.7%
Mortgage Type
Credit Line Revolving
Create a Home Valuation Report for This Property
The Home Valuation Report is an in-depth analysis detailing your home's value as well as a comparison with similar homes in the area
Purchase History
| Date | Buyer | Sale Price | Title Company |
|---|---|---|---|
| Johnson Nathan D | $67,000 | None Available | |
| Affinity Plus Federal Credit Union | $80,973 | None Available | |
| Ellenson Terry Lee | $140,000 | Complete Title Services Llc |
Source: Public Records
Mortgage History
| Date | Status | Borrower | Loan Amount |
|---|---|---|---|
| Closed | Johnson Nathan D | $63,650 | |
| Previous Owner | Ellenson Terry Lee | $73,000 |
Source: Public Records
Tax History
| Year | Tax Paid | Tax Assessment Tax Assessment Total Assessment is a certain percentage of the fair market value that is determined by local assessors to be the total taxable value of land and additions on the property. | Land | Improvement |
|---|---|---|---|---|
| 2024 | $1,602 | $230,200 | $58,500 | $171,700 |
| 2023 | $1,336 | $183,200 | $47,500 | $135,700 |
| 2022 | $1,026 | $166,100 | $42,300 | $123,800 |
| 2021 | $1,058 | $125,600 | $36,900 | $88,700 |
| 2020 | $972 | $98,100 | $29,146 | $68,954 |
| 2019 | $976 | $85,400 | $27,176 | $58,224 |
| 2018 | $970 | $79,900 | $23,041 | $56,859 |
| 2016 | $822 | $75,000 | $19,442 | $55,558 |
| 2015 | $670 | $68,100 | $20,867 | $47,233 |
| 2014 | $516 | $55,800 | $20,125 | $35,675 |
Source: Public Records
Map
Nearby Homes
- 27462 Raven Rd
- 23165 County 118
- 46962 parcel B 269th Ave
- 23837 State 200
- 26070 County 9
- TBD County 39 Rd
- TBD 450th St
- 31622 450th St
- TBD County 36
- 50743 Us 71
- 30371 Old Sunset Dr
- 170 Main St E
- 50836 Vinewood Rd
- 37276 Willow Rd N
- 37901 County 91
- 32597 Quail Ln
- 50164 County 29
- TBD N Plantangenet Rd SE
- 28229 County 93
- 47183 Cass Line Rd
- 25227 County 16
- 25190 County 16
- 25107 County 16
- 43875 255th Ave
- 24953 County 16
- 25566 Co Rd 16
- 25566 County 16
- 24816 County 16
- 25668 County 16
- 24765 County 16
- 25675 County 16
- 43473 255th Ave
- 24677 County 16
- 25863 County 16
- 24516 County 16
- 25961 County 16
- 43682 245th Ave
- 25986 County 16
- 24372 County 16
- xxxx 245th Ave
Your Personal Tour Guide
Ask me questions while you tour the home.